Figure 2.

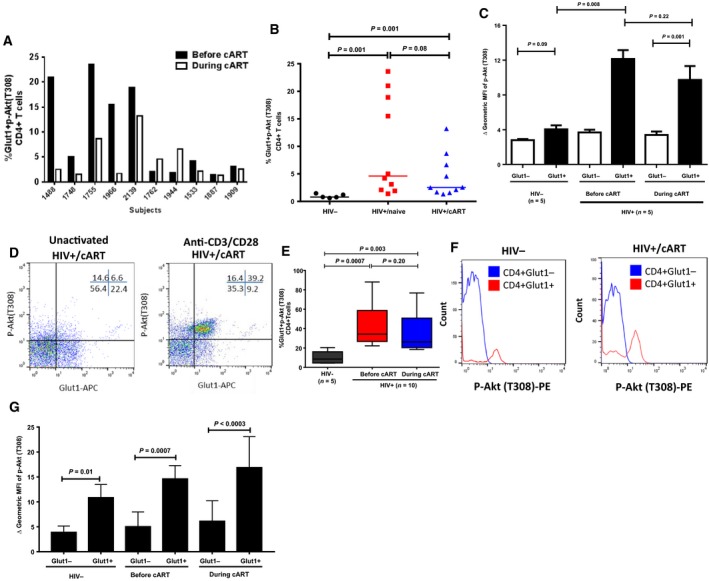
Glut1 cell surface expression on CD4+ T cells is associated with high PI3K activity. (A) Individual comparisons of changes in the percentage of CD4+Glut1+p‐Akt (T308)+ T cells in peripheral blood of HIV+ subjects before and during cART. (B) Aggregate percentage of CD4+Glut1+p‐Akt (T308)+ T cells in peripheral blood from HIV−, and HIV+ subjects before and during cART. (C) Geometric MFI of p‐Akt (T308) in Glut1− and Glut1+CD4+ T cells in PBMCs from HIV−, and HIV+ subjects before and during cART. (D) Representative dot plots showing percentage of CD4+Glut1+p‐Akt (T308)+ T cells within the CD4+ T cell populations of PBMCs from HIV+ subjects stimulated with anti‐CD3/28 microbeads, and (E) showing cumulative data. (F) Representative histogram showing the shift in fluorescence intensity of p‐Akt (T308)‐PE in CD4+ T cell compartments in PBMCs from HIV‐negative and HIV+/cART subjects stimulated with anti‐CD3/28 microbeads, with cumulative data represented in (G). The error bars represent mean (SEM). The paired t‐test and the Mann–Whitney t‐tests were used to measure significant differences within and between the groups, respectively.
