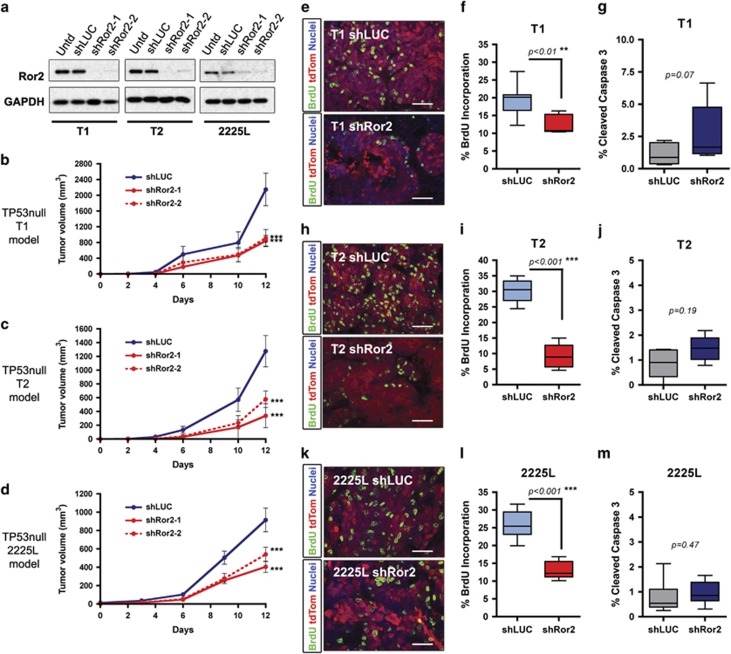
Figure 2.
Lentiviral silencing of Ror2 expression in basal-like TP53-null models impairs tumor growth. (a) Western blots for Ror2 illustrating shRNA depletion of Ror2 protein levels with two independent hairpins in T1, T2 and 2225L TP53-null basal-like models. GAPDH protein depicts equal loading between samples. (b–d) Tumor growth curves representing changes in tumor volume over time (days) for (b) T1, (c) T2 and (d) 2225L, comparing changes in tumor volume between shLUC control tumors and shRor2 tumors (n=6 tumors within each group, ***P<0.001). Volumes were calculated using the formula, volume=(length × width2)/2. (e,f,h,i,k,l) Proliferation of shLUC vs shRor2 tumors based on BrdU incorporation. (e,h,k) Representative immunofluorescence images of BrdU-positive cells (green) among transduced tumor cells (red) between shLUC and shRor2 groups within (e) T1, (h) T2 and (k) 2225L. Scale 50 μm. (f,i,l) Quantitation of BrdU-positive cells (green) among transduced tumors cells (red) between shLUC and shRor2 groups among (f) T1 (shLUC 19.4±4.2% vs shRor2 12.6±2.5%, n=6 **P<0.01), (i) T2 (shLUC 30.1±3.6% vs shRor2 9.1±3.8%, n=6, ***P<0.001), (l) 2225L (shLUC 26.1±3.9% vs shRor2 13.0±2.4%, n=6, ***P<0.001). (g,j,m) Quantitation of apoptosis, CC3 positivity, among transduced tumor cells between shLUC and shRor2 groups among (g) T1 (shLUC 1.0±0.4% vs shRor2 3.5±3.2%, n=6), (j) T2 (shLUC 0.90±0.52% vs shRor2 1.5±0.50%, n=6) and (m) 2225L (shLUC 0.80±0.65% vs shRor2 0.96±0.47%, n=6).

