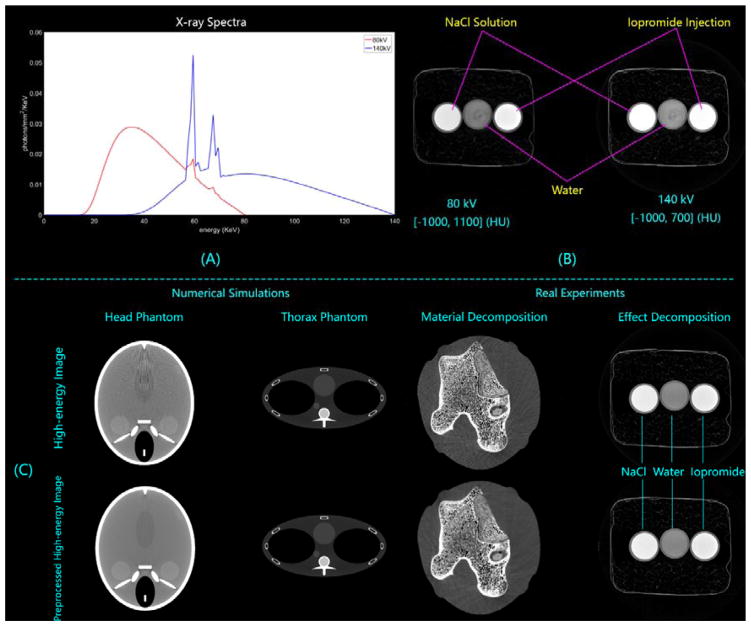
Figure 3.
Experimental setting in numerical simulations and real experiments. (A) The X-ray spectra used in the numerical simulations. (B) SSCT images of solution specimen scanned with different voltages (80 kV and 140 kV). The specimen consists of three different solutions (NaCl solution with NaCl density of 1.33g/ml, pure water, and Iopromide solution with Iopromide density of 0.04 g/ml), where the NaCl solution and the Iopromide solution fail to be distinguished in both results. (C) High-energy SSCT images without/with preprocess, where the results in the bottom row are employed as references in the proposed method.

