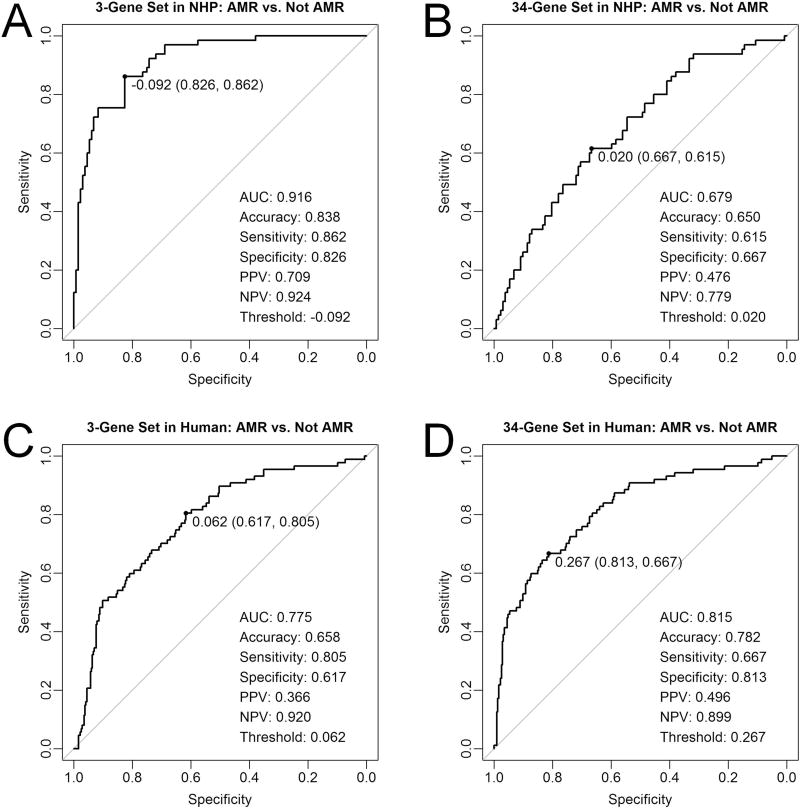
Figure 3. Receiver operating characteristic curves demonstrating diagnostic performance of gene expression testing in discriminating antibody-mediated rejection (AMR) cases from non-AMR cases, as defined by Banff 2015 criteria.
(A) Refined 3-gene set and (B) full 34-gene set in 197 nonhuman primate samples (NHP) analyzed with NanoString®. (C) Refined 3-gene set and (D) full 34-gene set in 403 human samples analyzed with microarray. Abbreviations: AUC, area under the curve; NPV, negative predictive value; PPV, positive predictive value.

