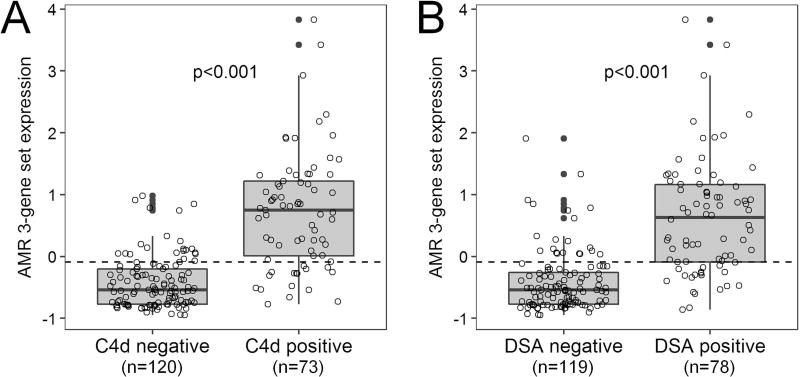
Figure 5. Gene expression box plots showing increased antibody-mediated rejection (AMR) 3-gene set expression in (A) C4d positive vs. negative cases and (B) donor specific antibody (DSA) positive vs. negative cases.
The ROC curve-derived diagnostic threshold for AMR (−0.092) is indicated by the dashed line.

