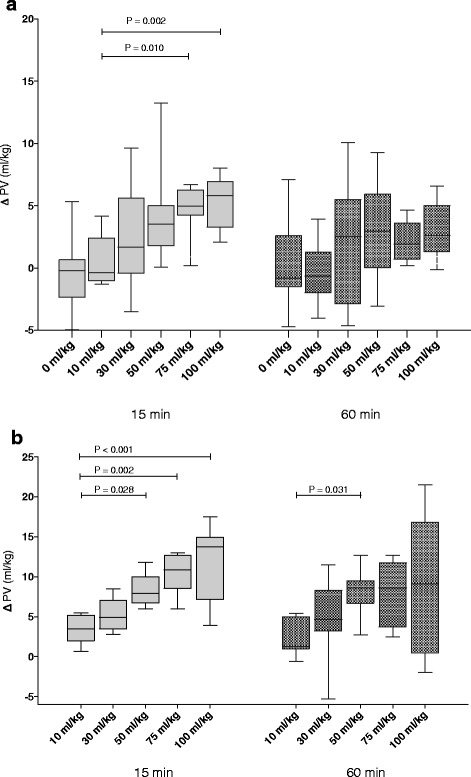
Fig. 4.

Change in plasma volume (∆ PV) in the sepsis and the hemorrhage groups at 15- and at 60 min after completion of fluid resuscitation. Panel a: Change in plasma volume in sepsis groups resuscitated with 10 ml/kg (n = 9, second bar from the left at each of the time points), 30 ml/kg (n = 10), 50 ml/kg (n = 10), 75 ml/kg (n = 8), 100 ml/kg (n = 8) and in animals not receiving fluid resuscitation (n = 10, first bar form the left, at each of the time points). b panel: Change in plasma volumes in hemorrhage groups resuscitated with 10 ml/kg (n = 7), 30 ml/kg (n = 8), 50 ml/kg (n = 8), 75 ml/kg (n = 8) and 100 ml/kg (n = 8) (* = P < 0.05). Data analyzed using one-way ANOVA on ranks and multiple comparisons were adjusted using the Dunn’s method
