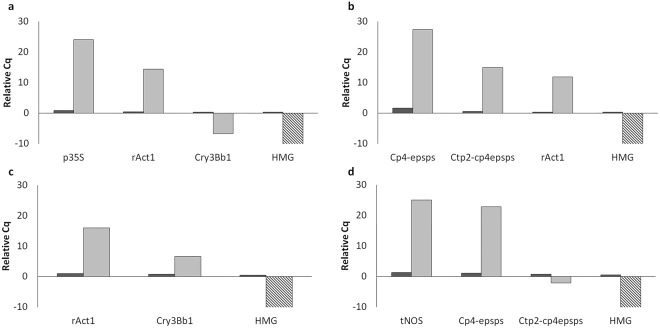
Figure 3.
Length-dependent increase of specific targets and loss of genomic background shown with qPCR. In all cases the amplicon closest to the element targeted for linear enrichment showed the highest increase in signal, expressed as the relative Cq value and calculated by subtracting the Cq after LE (dark bars) or snPCR (light bars) from the Cq of the starting material. This means the relative Cq value for each starting point is zero. Panel a: Enrichment for tNOS downstream. (b) Enrichment for tNOS upstream. (c) Enrichment for p35S downstream. (d) Enrichment for p35S upstream. In all panels, the dashed bars for HMG indicate a reduction beyond detection.

