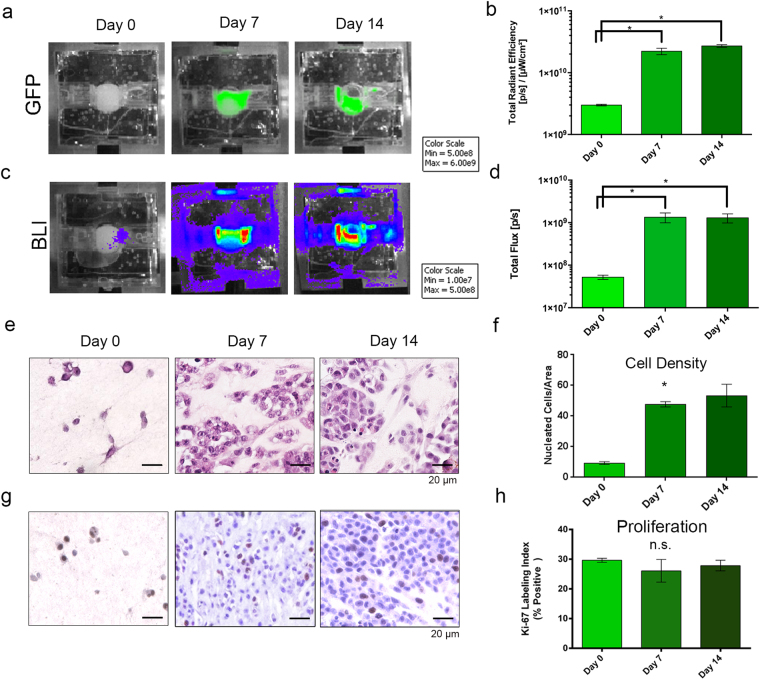
Figure 3.
Optical Imaging to Measure Cell Growth over Time. (a,c) Representative images of fluorescence (GFP) (a) and bioluminescence (c) imaging (BLI) over 14 days of culture (TNBC model). (b,d) ROI measurements from GFP and BLI images, respectively, showing increases in signals from day 0 to day 7 or 14 (Kruskal-Wallis test, p = 0.0002 (GFP) & p = 0.0003 (BLI)). (e) Photomicrographs of H&E-stained histologic sections from surrogates following 0 (left), 7 (middle), or 14 (right) days growth showing increased cell density after day 0 (200x magnification). (g) Photomicrographs of Ki-67 immunostaining (brown nuclei) following 0 (left), 7 (middle), and 14 (right) days growth indicating stable proliferation (200x magnification). (f) Measurement of cell density (number of nucleated cells per cross-sectional area) from H&E-stained histologic cross-sections of surrogates imaged for global GFP and BLI levels showing a similar trend as the optical imaging methods, with the majority of cell growth occurring over the first 7 days of culture (Kruskal-Wallis test, p = 0.039). (h) Ki-67 labeling index from surrogates imaged for global GFP and BLI levels show stable proliferation over the culture period (Kruskal-Wallis test, not significant). For optical imaging, n = 3–9 replicate surrogates per time point. Histologic analyses were completed on 3 replicate surrogates per time point. Data in b, d, f, & h represent mean ± SE.

