Figure 5.
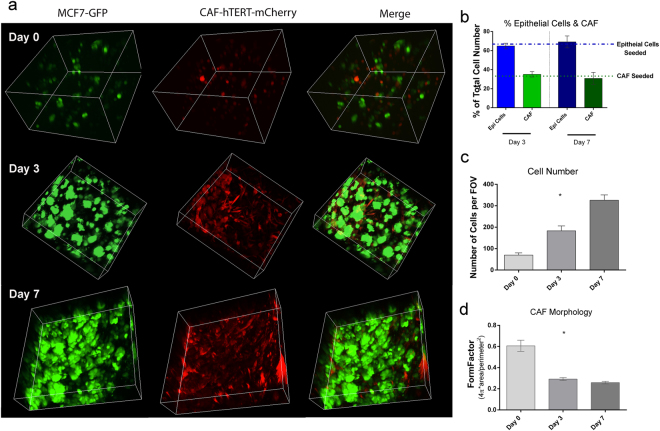
Confocal Microscopy to Evaluate Cellular Morphology and Population Dynamics. (a) Multiphoton confocal images (3D renderings) of ER+ tumor surrogates at days 0, 3, & 7, showing the GFP positive MCF-7 cells alone (green, left panels), the mCherry positive CAF-hTERT (red, middle panels), and both cell types together (merge, right panels) (250x magnification, 3D reconstructions are between 150 and 400 μm in thickness). (b) Epithelial to fibroblast ratio (green: red) was calculated from confocal maximum projections using CellProfiler and showed no significant change over time (Kruskal-Wallis test). The percentage of each cell population seeded (initial E:F = 2:1) is indicated by the dashed lines. (c) Total cell number (epithelial cells and CAF) was calculated from confocal maximum projections using CellProfiler and demonstrated an increase over time (Kruskal-Wallis test, p < 0.001, n = 4–7 FOV). (d) FormFactor, a measure of cellular circularity was calculated from confocal images using CellProfiler, with changes in CAF over time indicating cellular elongation (Kruskal-Wallis test, p < 0.0001, n = 4–7 FOV). Data in (b–d) represent mean ± SEM.

