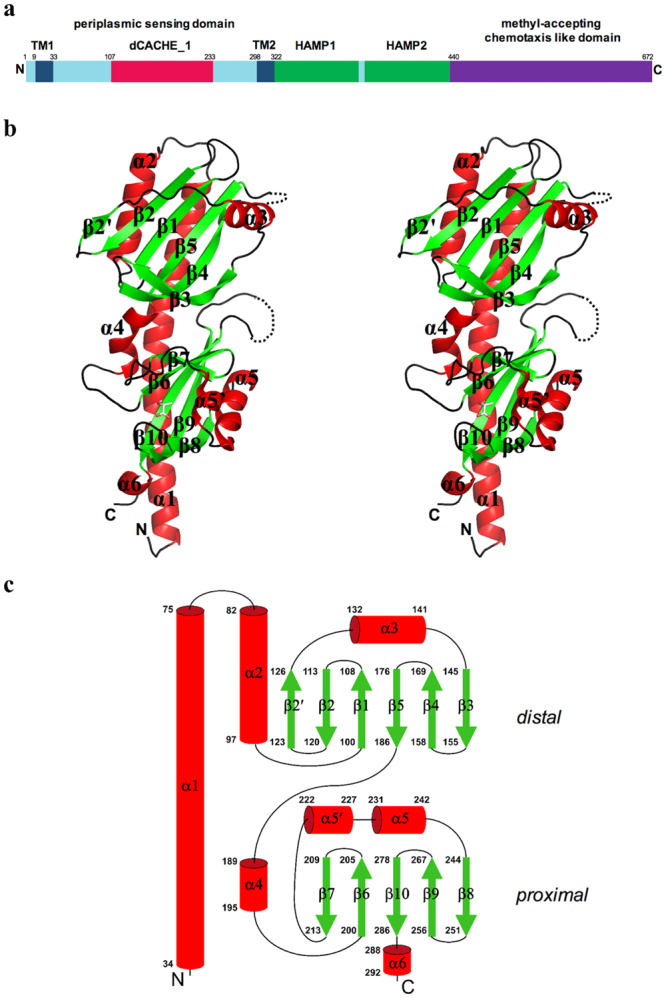
Figure 1.

Overall fold of TlpC dCACHE LBD. (a) Domain organisation of TlpC, showing LBD location with respect to other structural elements. Transmembrane region (TM, dark blue); dCACHE_1 domain (red), HAMP domains (green); methyl-accepting chemotaxis-like domain (purple). (b) Stereo representation of structure of TlpC LBD monomer. (c) Topology of secondary structure elements of TlpC LBD. The α-helices are represented by rods and β-strands by arrows. The membrane-distal and membrane-proximal subdomains are labelled.
