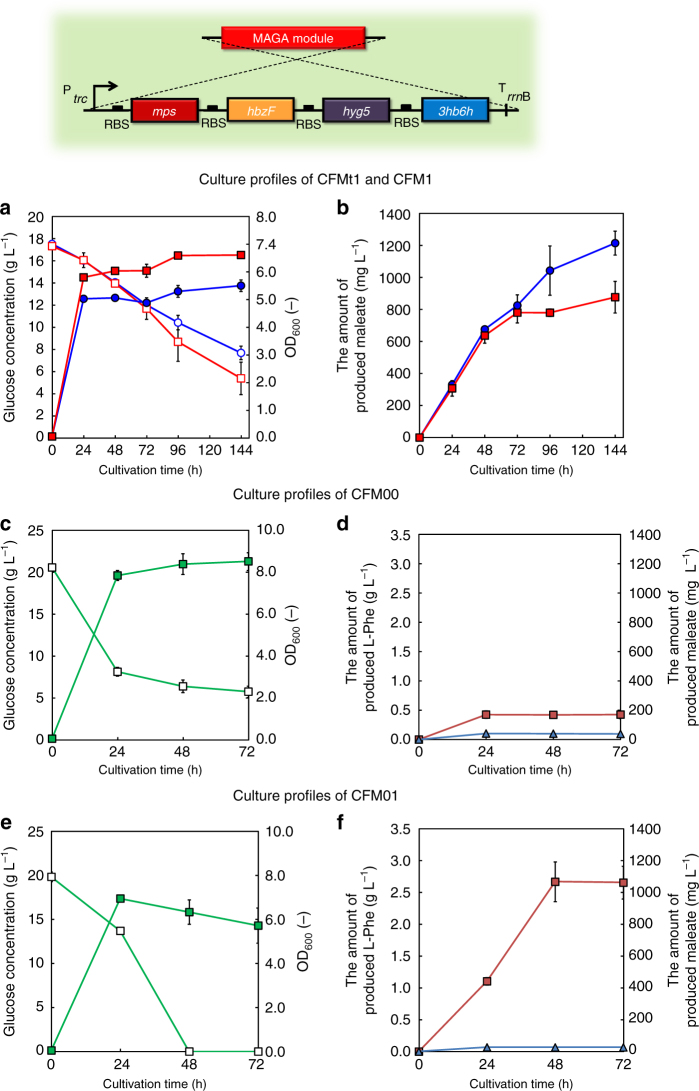
Fig. 6.
Culture profiles of various maleate-producing transformants. Time courses of a the bacterial cell growth and glucose concentration, and b the amount of produced maleate in the cultures of CFM1 (squares) and CFMt1 (circles). Time courses of c the bacterial cell growth (filled symbols) and glucose concentration (open symbols), and d the amount of produced maleate (triangles) and L-phenylalanine (squares) in the culture of CFM00. Time courses of e the bacterial cell growth (filled symbols) and glucose concentration (open symbols), and f the amount of produced maleate (triangles) and L-phenylalanine (squares) in the culture of CFM01. Data are presented as the mean ± standard deviation of three independent experiments (n = 3)

