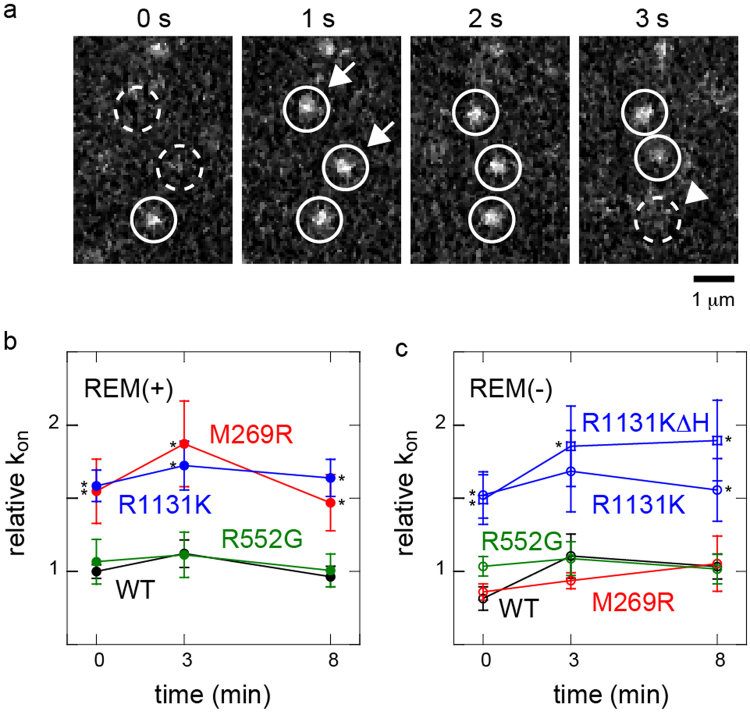
Figure 2.
Association rate constants of NS SOS protein molecules with membrane components. (a) Successive images on the cell surface showing the appearance (arrows) and disappearance (arrowhead) of single SOS molecules. (b,c) Relative association rate constants (kon) of SOS molecules with the cell surface. The molecules contained the REM(−) mutation (c) or did not (b). R1131KΔH contained the REM domain but the H domain was deleted. The appearance rate of fluorescent SOS molecules per unit area of the cell surface was normalized to the fluorescence intensity in the cytoplasm and plotted as values relative to that of WT SOS before EGF stimulation (time 0). Averages of 5–10 cells with SE. Asterisks indicate statistical significance relative to the densities in WT or WT REM(−) at the indicated times (p < 0.05 on Mann–Whitney test).

