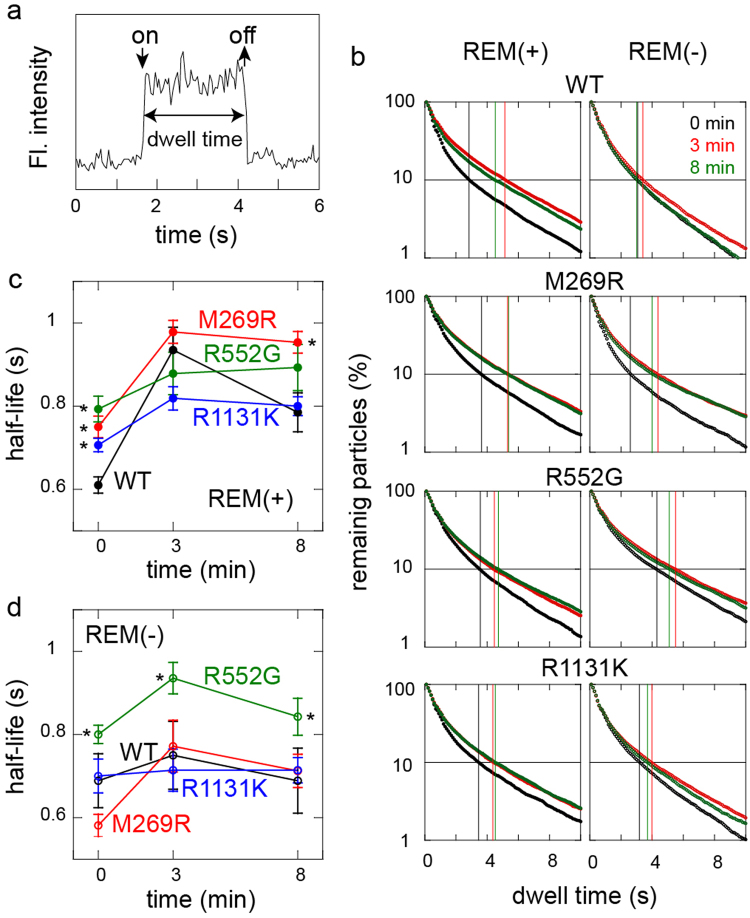
Figure 3.
Dwell time distributions of NS SOS mutants on the cell surface. (a) Example of the change in fluorescence intensity on the cell surface, showing the association (on) and dissociation (off) of a single SOS molecule. (b) Release curves of SOS molecules from the cell surface. Molecules contained the REM(−) mutation (left) or did not (right). A total of 624–7222 molecules were observed under each condition. Black, red, and green plots show the curves obtained after stimulation with EGF for 0, 3, and 8 min, respectively. The vertical lines show the dwell times at the 10% remaining points. (c,d) Half-lives of the SOS molecules on the cell surface were plotted as indicators of the dissociation kinetics. SOS molecules contained the REM(−) mutation (d) or did not (c). Average of 7–10 cells shown with SE. Asterisks indicate a significant increase (p < 0.05 on Mann–Whitney test) compared with the WT or WT/REM(−) under the corresponding conditions.

