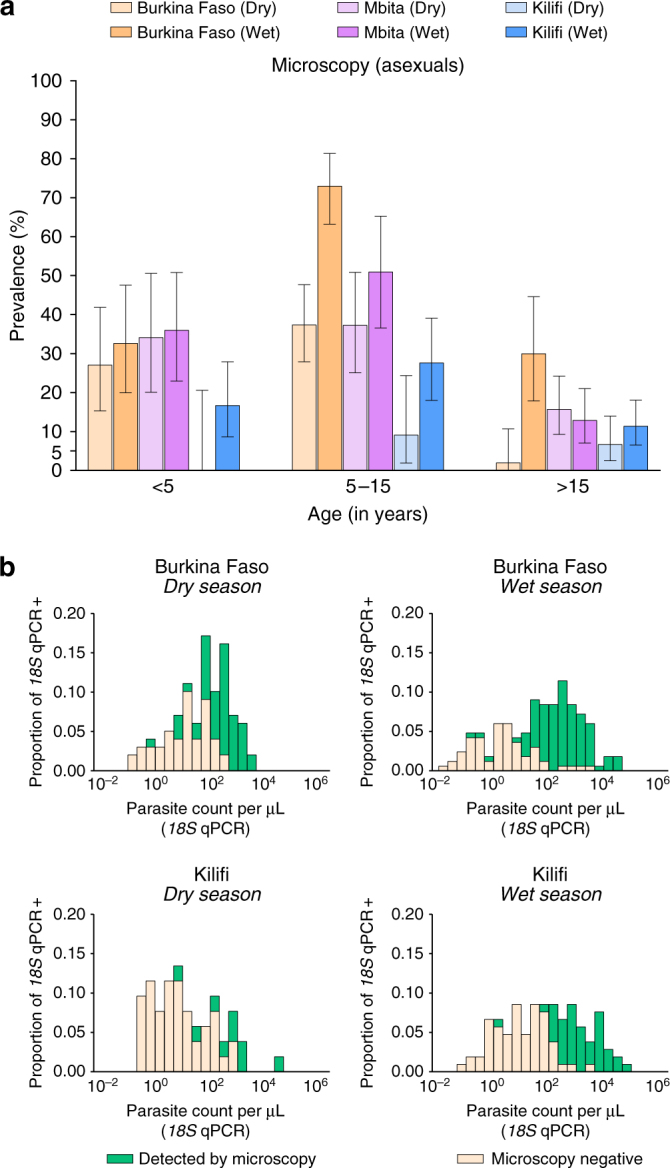
Fig. 1.

Age-specific asexual stage parasites prevalence by microscopy (a) and distributions of parasite densities (b) by study site. In a, 95% exact binomial confidence intervals are presented for microscopy-based parasite prevalence estimates. All participants, except three children in Laye and one in Balonghin, had microscopy results available; numbers of study subjects by age group and survey are presented in Table 1. In b, parasite densities quantified by DNA-based 18S qPCR are presented (log10 scale) for both patent and subpatent infections. This panel only includes 18S qPCR-positive samples (100, 166, 52 and 105 in Burkina Faso dry and wet season surveys, and Kilifi dry and wet season surveys, respectively)
