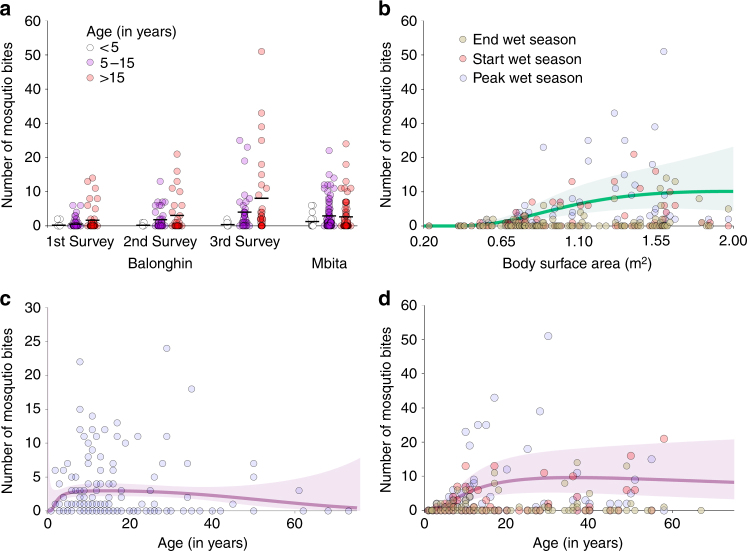
Fig. 2.
Mosquito exposure by age and body surface area. In a, the number of mosquito bites for each age group and survey is presented; each circle represents a study participant, and the mean number of mosquito bites per individual by age group is represented by horizontal black lines. In b–d, fractional polynomials were used to determine the models that best describe the relationships between mosquito bites and age in Mbita (c) and Balonghin (d) and mosquito bites and body surface area calculated using Dubois equation (b, data from Balonghin). The lines in b–d represent predicted numbers of mosquito bites per individual based on selected models (see ‘Methods’ section). The green (b) and purple (c, d) areas represent 95% confidence intervals

