
Figure 3.
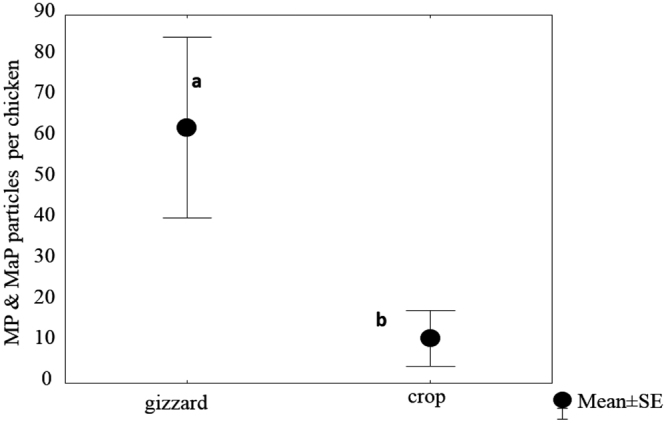
Macroplastics (MaPs) per crop and per gizzard. Different letters indicate significant differences among the concentration of macroplastics (after Kruskal-Wallis and Mann-Whitney U test, p < 0.05).
Official websites use .gov
A
.gov website belongs to an official
government organization in the United States.
Secure .gov websites use HTTPS
A lock (
) or https:// means you've safely
connected to the .gov website. Share sensitive
information only on official, secure websites.
Macroplastics (MaPs) per crop and per gizzard. Different letters indicate significant differences among the concentration of macroplastics (after Kruskal-Wallis and Mann-Whitney U test, p < 0.05).