Figure 3.
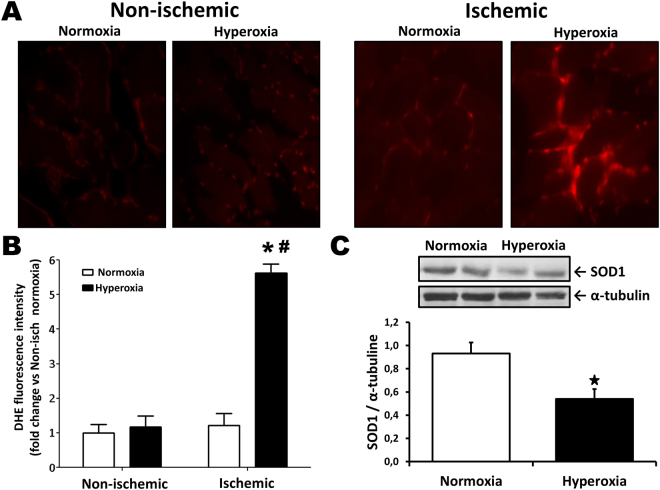
Neonatal hyperoxia and oxidative stress levels after ischemia. (A,B) Oxidative stress levels (DHE staining) in non-ischemic muscles and in ischemic muscles at day 7 after surgery. (C) Representative Western blots and quantitative analyses of SOD1 in ischemic muscles Data were normalized using loading controls (α-tubulin) and are presented as mean ± SEM (n = 8/group). *P < 0.05 vs. normoxia ischemic. # P < 0.05 vs. hyperoxia non-ischemic.

