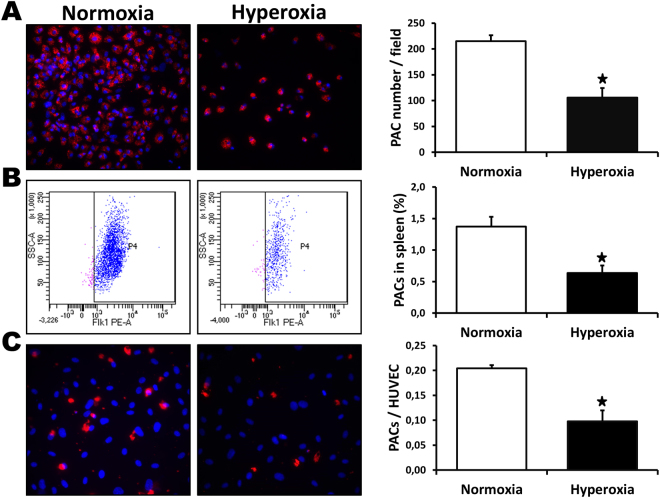
Figure 5.
Effect of neonatal hyperoxia on PAC number and function. Number of PACs isolated from the bone marrow (A) and % of PACs in the spleen as assessed by flow cytometry (B) in mice exposed to neonatal hyperoxia or normoxia. To assess PAC adhesion (C), PACs were labelled with a DiI fluorescent marker and allowed to adhere to a monolayer of tumor necrosis factor-α-stimulated HUVECs. Data are mean ± SEM (n = 4–6/group). *P < 0.05 vs. normoxia.

