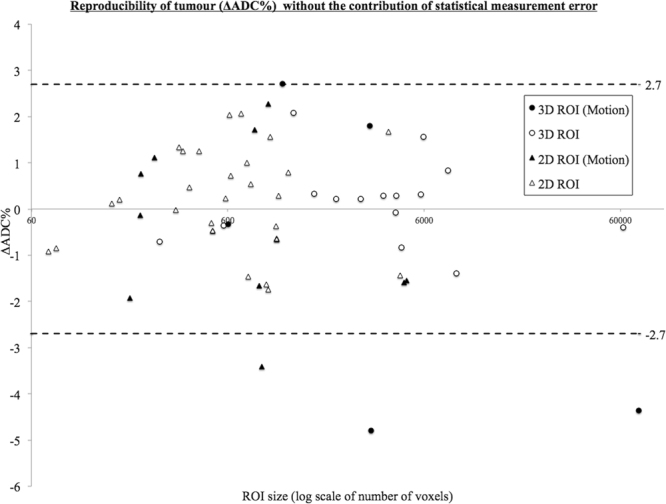
Figure 4.

The improvement in estimating repeatability measurements after accounting for the contribution of statistical measurement error. ∆ADC% is plotted against ROI size (log scale of number of voxels) for 3D and 2D tumour regions (3D circles, 2D triangles). Data affected by motion is highlighted (solid black). When the contribution of statistical measurement error is factored out (compared to Fig. 2), the 95% confidence interval width improves from 21.1% to 2.7%. The majority of data affected by motion become outliers, regardless of their size.
