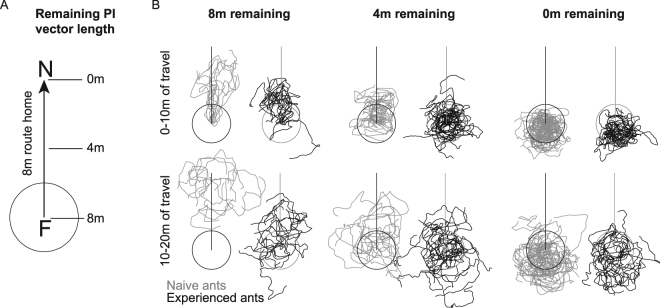
Figure 1.
Schematic of experimental set up and 20 m of path from all ants tested. (A) Ants travelled a route between a feeder (F) 8 m from their nest (N) and their home. Experienced ants were taken for a test after 2 days of shuttling back and forth, while naïve ants were taken after their first arrival. Ants were taken either from the feeder (8 m condition, 8 m of vector remaining), half way on the route home (4 m condition, 4 m of vector remaining) or just before they entered their nest (0 m condition, 0 m of vector remaining). PI = path integration. (B) All paths run by the tested ants divided into the first 10 m of path length and the second 10 m of path length. A circle 2 m in radius has been drawn around each graph to help readers visualise the starting region on tests. No such circle was actually drawn at the test site.

