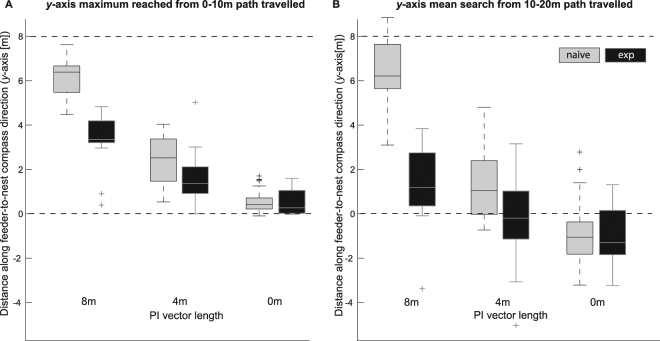
Figure 2.
Proxy measures estimating extent of path integration (A) and centre of search (B). (A) The maximum value along the y-axis, which runs from the release point (0) in the feeder-to-nest direction, in the first 10 m of path length. (B) The mean value of all digitised points along the y-axis in the segments of paths from 10 m to 20 m of path length. The top dotted line indicates the y value of the fictive nest, where the nest would lie had the ants not been displaced for the test. The bottom dotted line indicates the y value of the release point. The boxes show the median in the centre line, and interquartile ranges at their top and bottom. The tails show values that are 1.5 times the distance from the median to each quartile. The + symbols show outlying values beyond the tails. PI = path integration.

