
Figure 3.
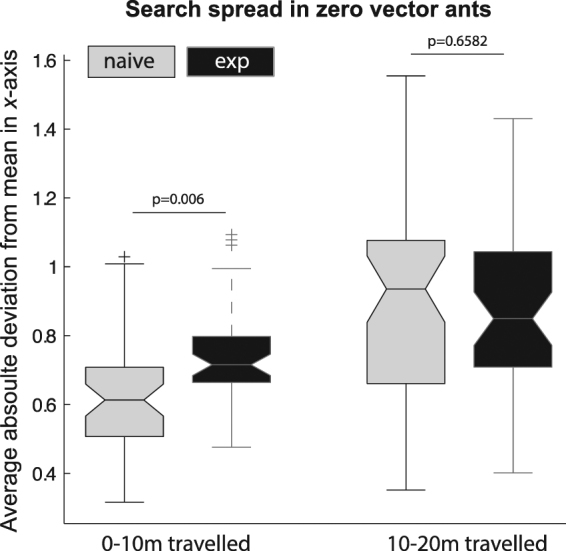
Proxy measure of search spread for zero-vector ants (0 m condition). The dependent measure was the mean absolute deviation of all digitised points along the x-axis, which is perpendicular to the feeder-to-nest direction. The measure is divided into the first 10 m of travel and the next 10 m of travel. The boxes show the median in the centre line, the interquartile ranges at their top and bottom, and the 95% confidence interval about the mean at their shoulders. The tails show values that are 1.5 times the distance from the median to each quartile. The + symbols show outlying values beyond the tails.