Figure 2.

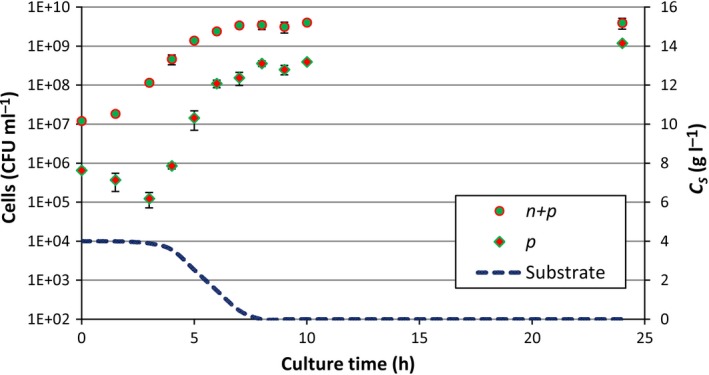
Total (n + p) and persistent (p) populations in the antibiotic‐free batch culture. The persistent population was assessed for each of the three experiments with an initial glucose concentration of 4.0 g l−1 separately. The error bars represent the standard deviation of the three experiments. The dynamics of the persistent population shows the pattern of type I persistence. The persister population starts to increase when the substrate concentration (CS) starts to diminish significantly.
