Figure 5.

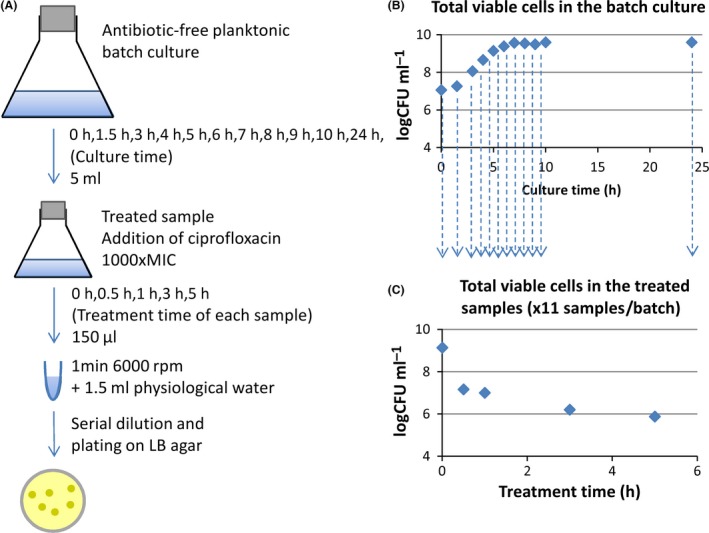
Experimental design used to obtain data to calibrate the models.
A. 5 ml samples were regularly taken from an antibiotic‐free batch culture, put into a new flask and treated with 1000‐fold the ciprofloxacin MIC. Treated cultures were themselves sampled over time to determine the number of CFUs.
B. The total cells in the batch cultures showed the classical phases of bacterial growth: the lag, exponential and stationary phases.
C. Characteristic biphasic killing curve obtained by quantifying viable cells over time in treated samples. One killing curve is obtained for each 5 ml sample from the batch culture.
