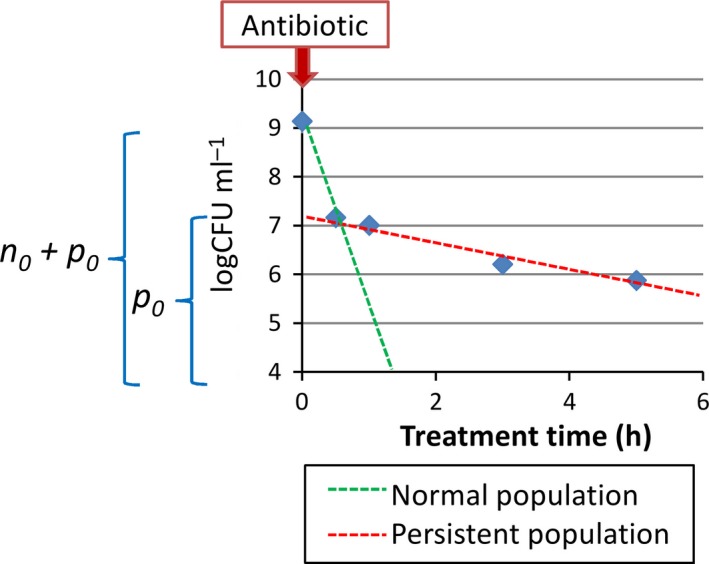
Figure 6.

Characteristic biphasic killing curve of a population treated with a high dose of antibiotic (here 1000‐fold the ciprofloxacin MIC). The initial persister fraction in the sample, p 0, can be obtained from the dynamics of the total viable cells (n + p) over time under antibiotic treatment.
