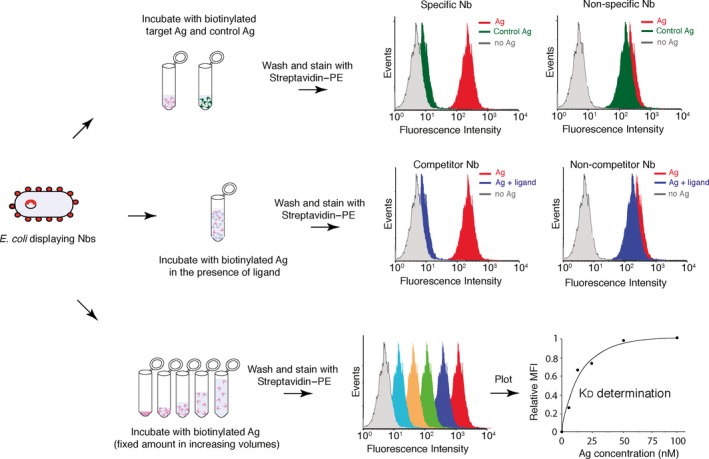
Figure 5.

Fluorescence flow cytometry analysis for the characterization of the antigen‐binding properties of nanobodies displayed on E. coli. Scheme showing different applications of fluorescence flow cytometry for the characterization of the antigen (Ag)‐binding properties of Nbs displayed on E. coli. Top: incubation of bacteria with target and control Ags (e.g. labelled with biotin) to determine binding specificity. Central: incubation of bacteria with labelled Ag in the presence or absence of a ligand (i.e. a molecule binding the Ag) for the identification of Nbs competing or not competing with ligand binding. Bottom: incubation of bacteria with different concentrations of the labelled Ag for the estimation of equilibrium dissociation constant (KD) by plotting Ag concentrations versus mean fluorescence intensity (MFI) values. All examples shown use Streptavidin–phycoerythrin (PE) for fluorescent staining of bacteria with bound biotinylated Ag.
