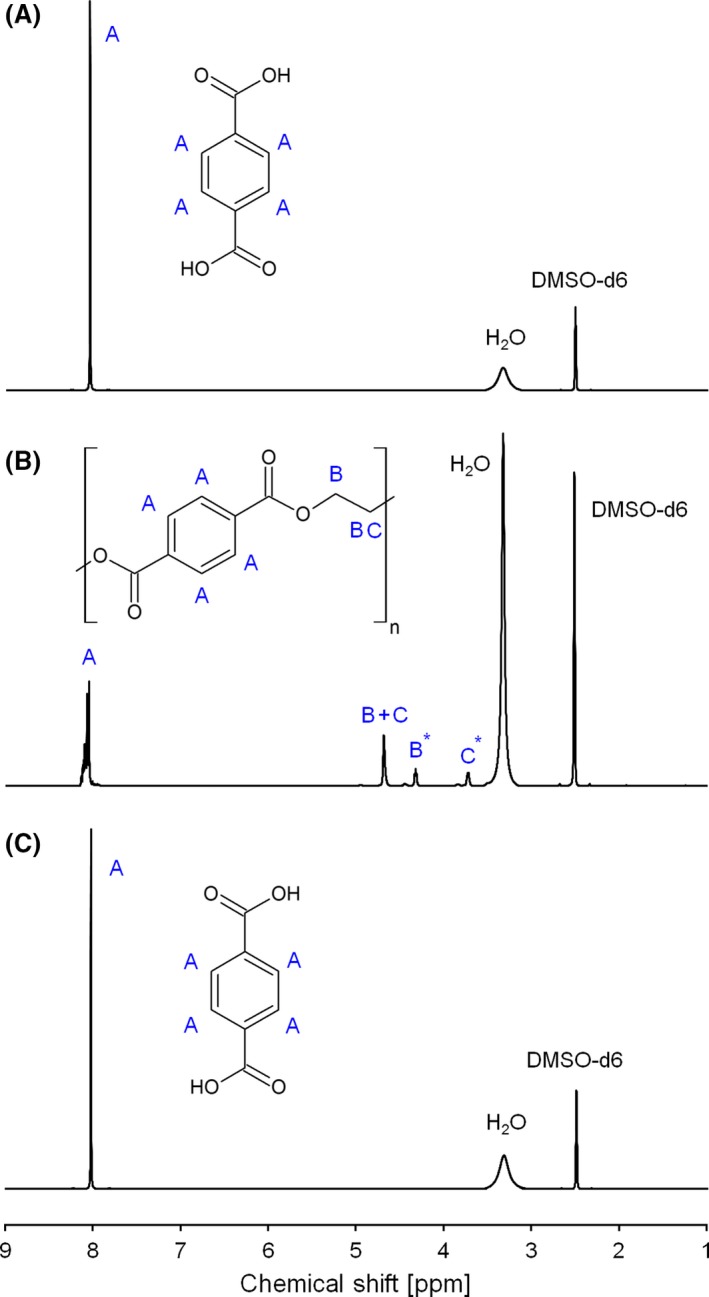
Figure 5.

1H‐NMR of pure TA (A), PET degradation after the chemical treatment (Sample 4, B) and PET degradation after enzymatic finishing (C). All spectra were recorded in DMSO‐d6. All samples were fully soluble in the selected solvent. For detailed proton assignments, please see ESI.
