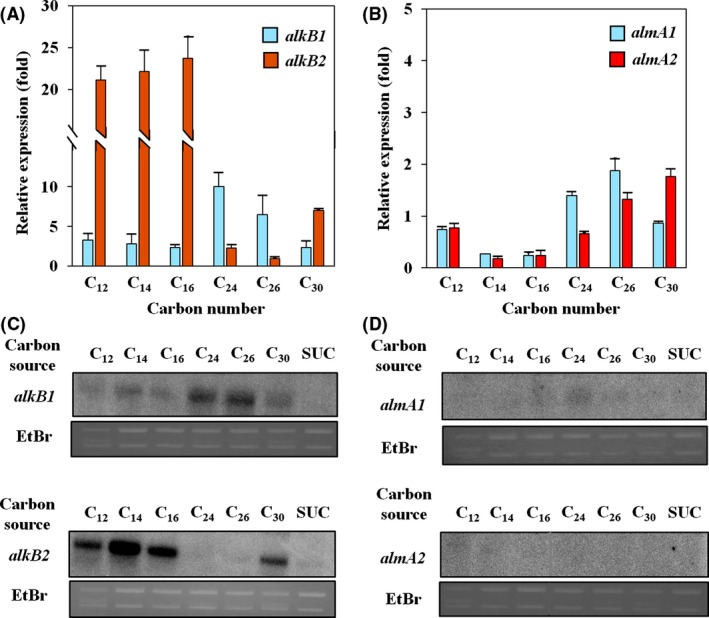
Figure 2.

Relative expression levels of (A) alkB1 (cyan bar), alkB2 (red bar), (B) almA1 (cyan bar) and almA2 (red bar) along medium‐chain alkanes to long‐chain alkanes (C12, C14, C16, C24 and C30) were measured by qRT‐PCR. The fold changes are defined as the expressions of each gene with alkanes comparing to 10 mm succinate. The expression levels of each gene were normalized by 16S rDNA. Northern blotting was also performed to visualize the expression of (C) alkB and (D) almA. A consistent amount of total RNA was loaded, which is shown by the ethidium bromide‐stained gel (EtBr).
