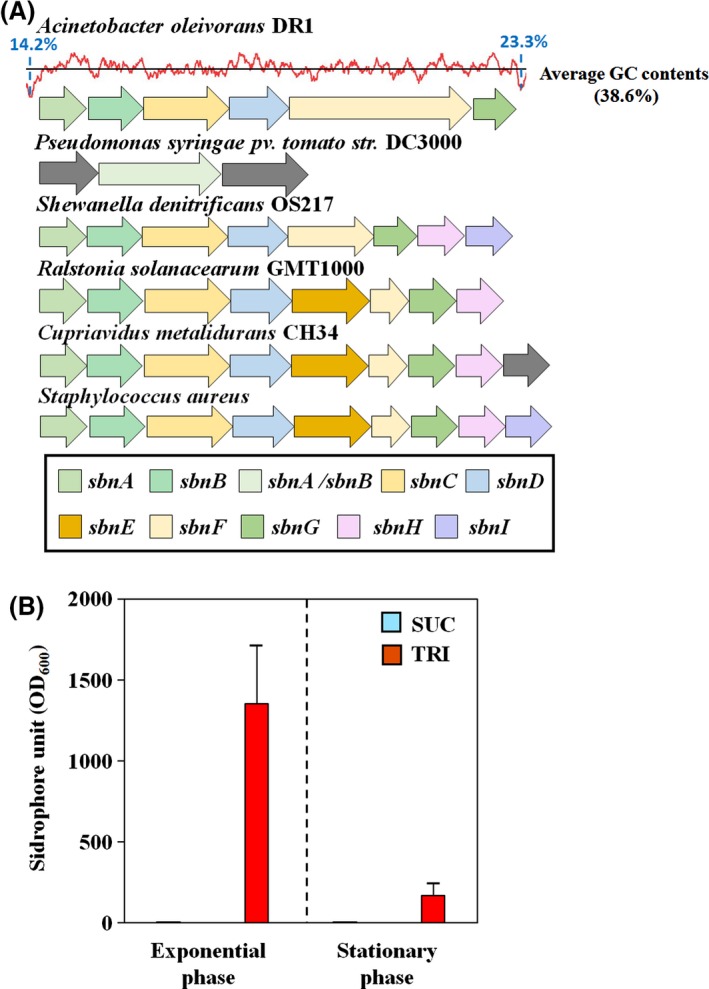
Figure 5.

(A) AA alignment of sbn operon with other Gram‐negative strains and Gram‐positive Staphylococcus aureus. The red graph indicates GC contents in the sbn operon in DR1 genome, and the black line shows the average GC contents. Blue‐coloured GC contents were extremely lower than average. Different genes were coloured as shown in the boxes. (B) CAS assay for quantification of siderophore production under SUC and TRI supplementation. Siderophore production was not detected under SUC supplementation at both the exponential and stationary phase. Siderophore units were standardized by OD 600.
