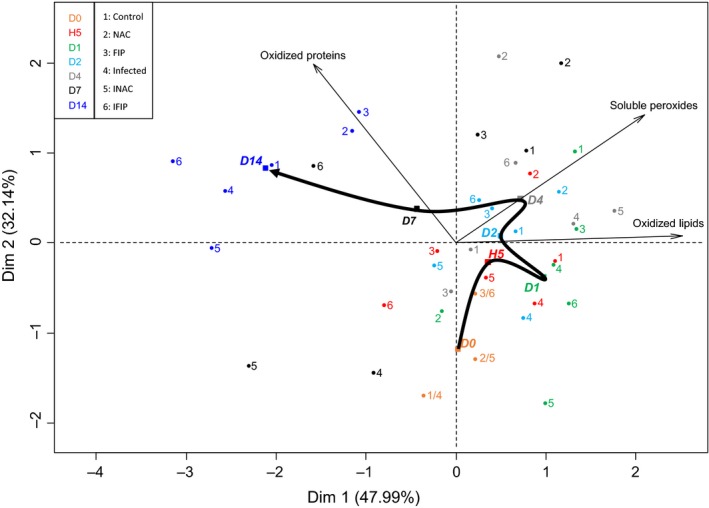
Figure 5.

Principal component analysis of the three variables (lipid oxidation, soluble peroxide production and protein oxidation) in the honeybee midguts during the experiment timeline.
The points of each group at different times in the experiment (D0–D14) were projected, and the barycentre of each day for all combined conditions was determined. The bold black arrow connects barycentre points to highlight the temporal order of the three events: lipid oxidation, soluble peroxide production and protein oxidation.
