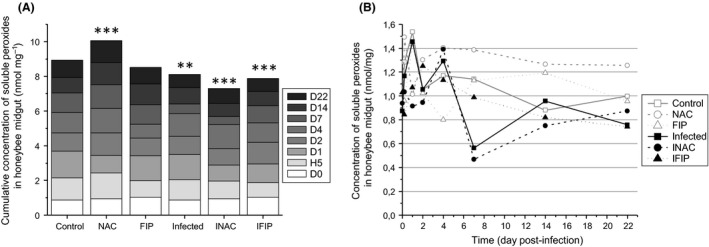
Figure 7.

Concentration of soluble peroxides in the midguts of honeybees exposed to fipronil or N‐acetylcysteine and/or infected with N. ceranae.The amount of peroxides was evaluated with the ferrous ion oxidation–xylenol orange (FOX) method from 21 midguts/day/condition in quadruplicate. A represents the cumulative concentration of soluble peroxides for each group, and B represents the kinetics of the soluble peroxide concentrations for each group from D0 to D22. Asterisks indicate significant differences compared with the control group (**P ≤ 0.01; ***P ≤ 0.001). Details regarding P‐values can be consulted in supporting information Tables S2 and S3.
