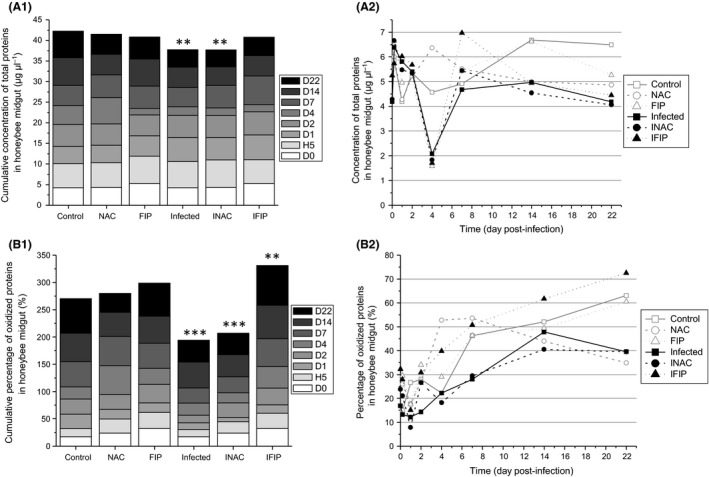
Figure 8.

Effect of the treatments on both protein concentration and protein oxidation. The measures were performed from 12 midguts/day/condition.A. Quantification of midgut total protein concentration: A1, cumulative protein concentration for each group. A2, kinetic of protein concentration for each group.B. B1, cumulative percentage of oxidized protein for each group. B2, kinetic of percentage of oxidized protein in bee midguts for the six experimental groups. Asterisks in A1 and B1 indicate significant differences compared with the control group (**P ≤ 0.01; ***P ≤ 0.001). Details regarding P‐values are reported in supporting information Tables S2 and S3.
