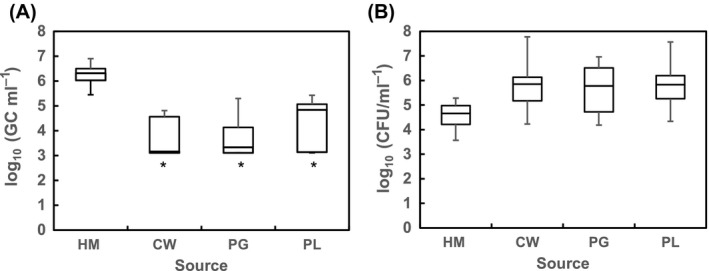
Figure 2.

Densities (represented in box‐and‐whisker plot graphs) of (A) crAssphage (GC/ml) and (B) Escherichia coli (CFU/ml) in the different source samples: HM, human sewage (n = 23); PG, porcine wastewater (n = 15); CW, cow wastewater (n = 12); PL, poultry wastewater (n = 14). *, in these samples the lowest fence value in the graph corresponds to the limit of quantification of the qPCR as some of the samples were considered negative in the qPCR; therefore, the actual lowest value is expected to be lower than the plotted value.
