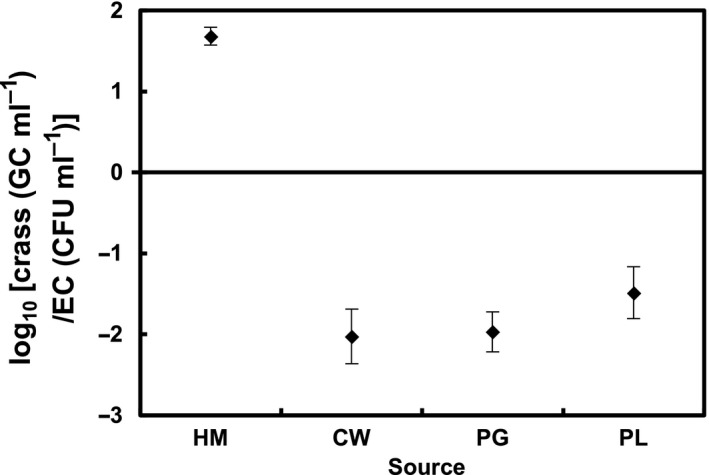
Figure 3.

Observed log10 ratio [crAssphage (GC/ml)/Escherichia coli (CFU/ml)] for the different faecal pollution sources (mean ± standard error). crass: crAssphage; EC: E. coli.

Observed log10 ratio [crAssphage (GC/ml)/Escherichia coli (CFU/ml)] for the different faecal pollution sources (mean ± standard error). crass: crAssphage; EC: E. coli.