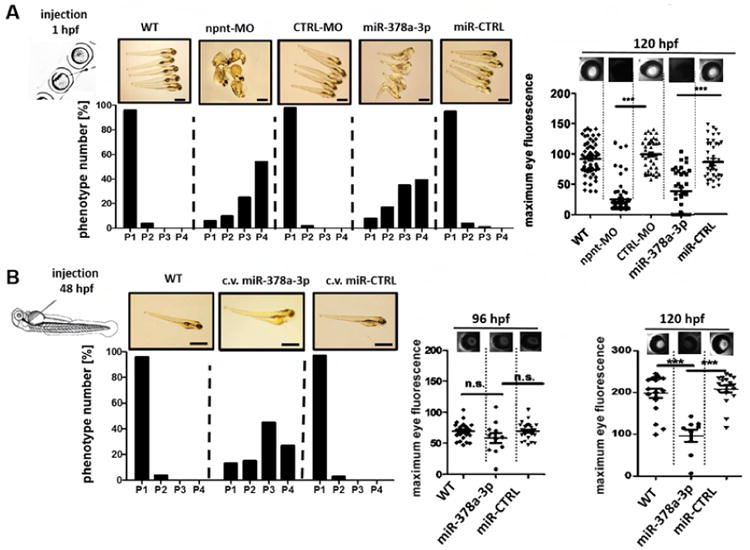
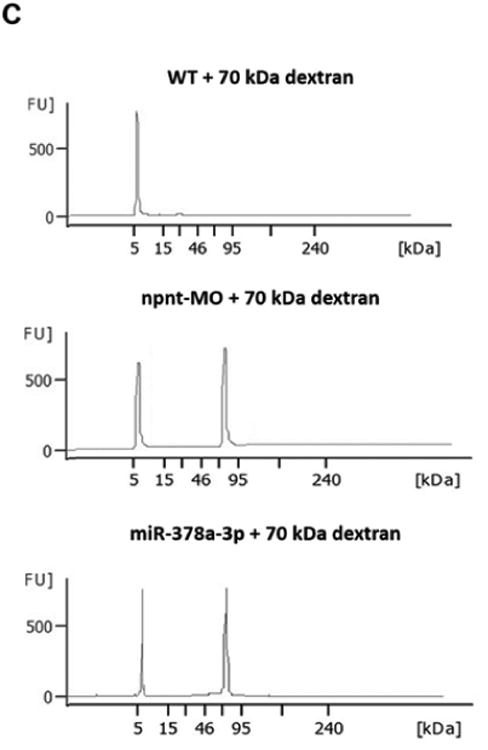
Figure 2. Npnt knockdown by morpholino or injection of miR-378a-3p in zebrafish larvae induces edema and proteinuria.


(A). Quantification of edemous phenotype (left panel) and loss of circulating high molecular weight proteins by measuring max. eye fluorescence in the retinal vessel plexus of Tg(l-fabp:DBP:EGFP) zebrafish (right panels) at 120 hours post fertilization (hpf). Zebrafish were injected with a npnt specific morpholino (npnt-MO (100 μM)), a scrambled control morpholino (CTRL-MO (100 μM)), a miR-378a-3p mimic (25 μM) or a miR-CTRL (25 μM) at 1 hpf compared to uninjected wildtype animals (WT). Scale bar = 500 μm.
(B). Quantification of edemous phenotype (left panel) and loss of circulating high molecular weight proteins by measuring max. eye fluorescence in the retinal vessel plexus of Tg(l-fabp:DBP:EGFP) zebrafish (right panels) at 96 hpf and 120 hours post fertilization (hpf). Zebrafish larvae were injected with a miR-378a-3p mimic (25 μM) or a miR-CTRL (25 μM) in the cardinal vein (c.v.) at 48 hpf compared to WT condition. The edemous phenotype of the larvae was categorized in 4 groups: P1 = no edema, P2 = mild edema, P3 = severe edema, P4 = very severe edema. Fluorescent images of the retinal vessel plexus of Tg(l-fabp:DBP:EGFP) zebrafish larvae at 96 hpf injected with morpholinos or miRNAs as indicated. Graph represents maximum fluorescence intensity detected in the fish eye. *** p<0.001, n.s. not significant. Scale bar = 500 μm.
(C). Zebrafish water after injection of a red fluorescent 70 kDa dextran in npnt-MO (100 μM) or miR-378a-3p mimic (25 μM) treated zebrafish larvae was analysed by protein on chip electrophoresis. The first peaks represents 5 kDa marker peak, second peak represents detected 70 kD dextran. Each sample consisted of pooled medium from 10 fish kept in 200 μl embryo raising medium for 48 h.
