
Figure 6. MiR-378a-3p mimic injection leads to albuminuria, podocyte effacement and altered expression of podocin in mice.
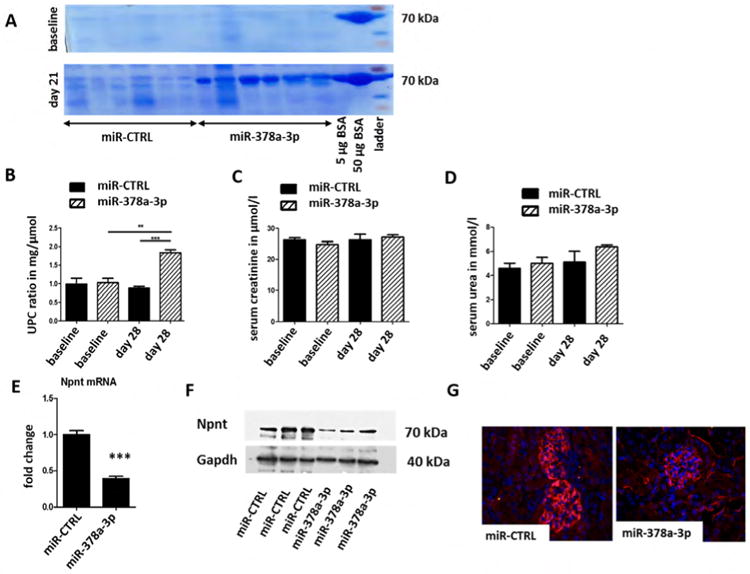
Mice were either injected with a miR-CTRL (0.2 mg/ mouse) or a miR-378a-3p mimic (0.2 mg/mouse) at day 0, 3, 7 and 14. n = 12.
(A) Coomassie gel from urine samples of mice injected with either miR-CTRL or miR-378a-3p mimic at baseline and 28 days after the first injection. 5 μg and 50 μg BSA were also run on both gels. BSA: bovine serum albumin. UPC-ratio (B), serum creatinine (C) and serum urea (D) of miR-CTRL and miR-378a-3p mimic injected mice at baseline and 28 days after the first injection. ** p< 0.01, *** p< 0.001. Measurements were performed with OLYMPUS. Differences in serum creatinine and serum urea were not significant.
(E) Real-time PCR for Npnt mRNA expression in whole kidney sections of mice injected with either miR-CTRL or miR-378a-3p mimic at baseline and 28 days after the first injection.
(F) Western blot of whole kidney sections of mice injected with either miR-CTRL or miR-378a-3pmimic at baseline and 28 days after the first injection. Western blot bands were normalised to Gapdh.
(G) Immunofluorescent staining for Npnt (red) and DAPI nuclear staining (blue) on paraffin sections of glomeruli from miR-CTRL (0.2 mg/ mouse) and miR-378a-3p mimic (0.2 mg/ mouse) injected mice.
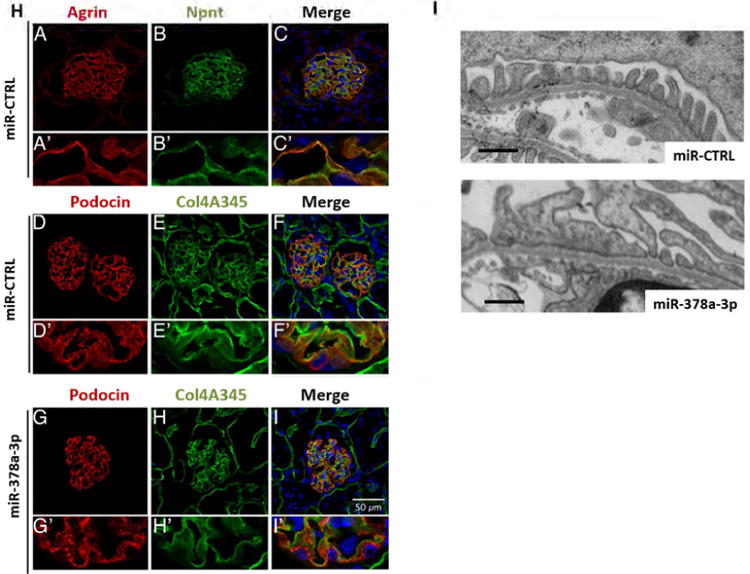
(H) Immunofluorescent staining for agrin (red, A, A′) and Npnt (green, B, B′) on cryo sections of glomeruli from miR-CTRL injected mice. The merged picture (C, C′) shows a partial overlap of agrin and Npnt in the GBM in orange. Immunofluorescence staining for podocin (red D, D′, G, G′) and collagen 4A345 (green E, E′, H, H′) on cryo sections of glomeruli from mice injected with miR-CTRL (0.2 mg/ mouse, D-F) or miR-378a-3p mimic (0.2 mg/ mouse G-I). F, F′, I and I′ show the merged pictures. Podocin staining shows a speckled pattern in miR-378a-3p mimic injected mice. Scale bar = 50 μm.
(I) Transmission electron microscopy pictures of glomeruli from mice injected with miR-CTRL (0.2 mg/ mouse) or miR-378a-3p mimic (0.2 mg/ mouse) at day 0, 3, 7 and 14. MiR-378a-3p injected mice develop podocyte effacement. Scale bar = 500 nm.