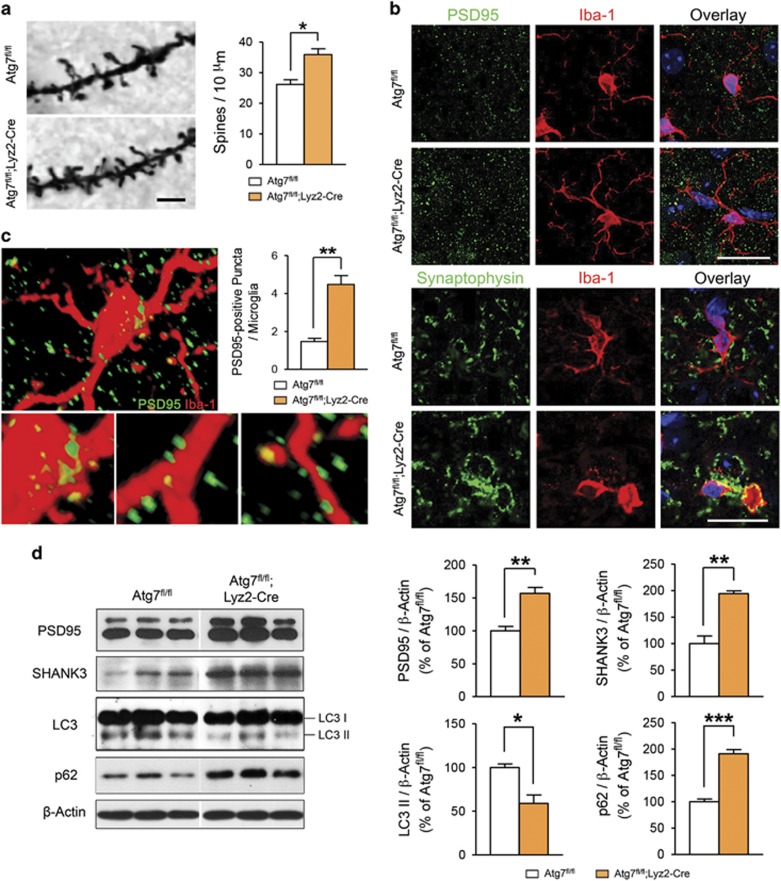
Figure 3.
Increased dendritic spine density in mice with Atg7-deficient microglia. (a) Representative images of dendrites in the somatosensory 2 (S2) brain region from Atg7fl/fl and Atg7fl/fl;Lyz2-Cre mouse after Golgi-Cox staining. The number of dendritic spines in Atg7fl/fl;Lyz2-Cre mice was significantly increased compared with control mice at postnatal day 15. n=150 segments for Atg7fl/fl, n=60 segments for Atg7fl/fl;Lyz2-Cre. Scale bar=2 μm. (b) PSD95 and synaptophysin immunoreactivity was more frequently co-localized with Iba-1 immunoreactivity in the brain of Atg7fl/fl;Lyz2-Cre mice than that of Atg7fl/fl mice. Representative images from each group are shown. Scale bar=20 μm. (c) Three-dimensional confocal image, constructed from serial confocal z-stack images, of Iba-1-positive microglia (red) from an Atg7fl/fl;Lyz2-Cre mouse. High-magnitude images of PSD95-positive puncta (green) engulfed by Iba-1-positive microglia are shown in the lower panel. The number of PSD95-positive puncta per microglia (yellow) was significantly increased in Atg7fl/fl;Lyz2-Cre mice compared with controls at postnatal day 12. n=40 cells for each group. (d) Western blot images of synaptic markers (PSD95 and SHANK3) and autophagy-related proteins (LC3-II and p62). Intensities of both PSD95 and SHANK3 were significantly higher in Atg7fl/fl;Lyz2-Cre mice than in the controls. In Atg7fl/fl;Lyz2-Cre mice, the LC3-II intensity was decreased and that of p62 is increased compared with Atg7fl/fl mice. n=5 for each group. *P<0.05, **P<0.01, ***P<0.001 (two-tailed Student’s t-test).

