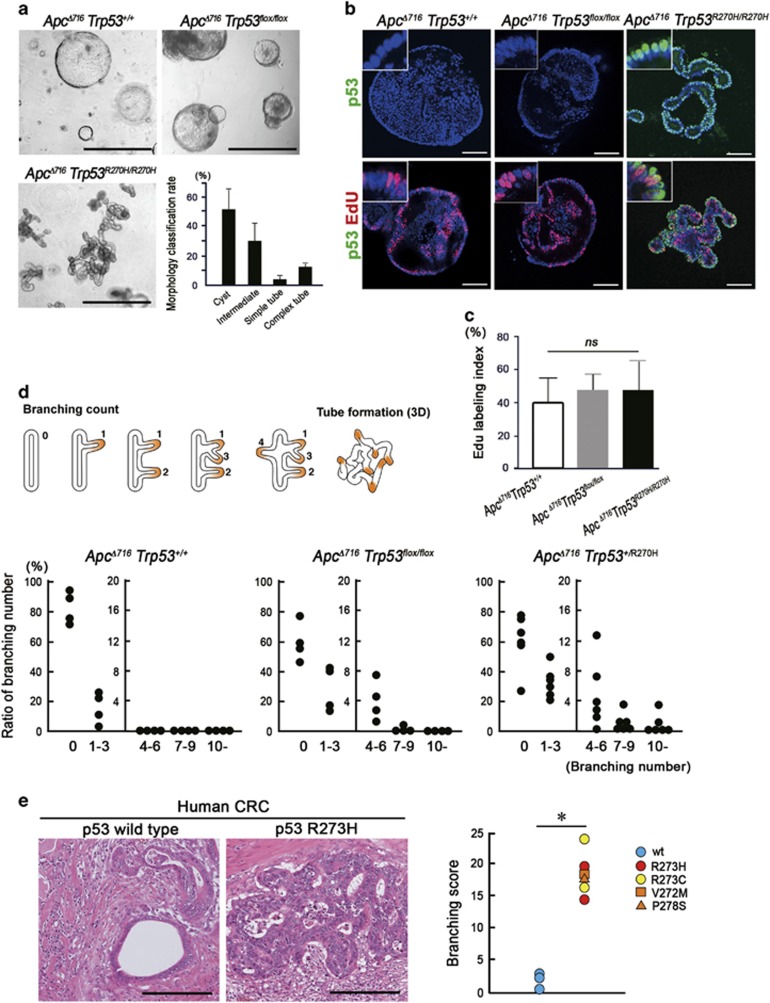
Figure 3.
Induction of morphological changes of the tumors by mutant p53R270H. (a) Representative photographs of the indicated genotype organoids. Bars, 1 mm. The ratios of morphological classifications of ApcΔ716 Trp53R270H/R270H organoids are shown as a bar graph (mean±s.d.) (bottom right). (b) Representative confocal microscopy images of ApcΔ716 Trp53+/+ (left), ApcΔ716 Trp53flox/flox (center) and ApcΔ716 Trp53R270H/R270H tumor organoids (right). Fluorescence immunostaining for p53 (green, top) and double immunostaining for p53 and EdU (green and red, respectively, bottom) with DAPI staining (blue). The insets show enlarged images. Bars, 100 μm. (c) The EdU labeling index of tumor organoids is shown (mean±s.d.). ns, not significant. (d) A schematic diagram of the representative patterns of intestinal tumor branching leading to tube formation (top). The ratio of the branching number classification of ApcΔ716 Trp53+/+, ApcΔ716 Trp53flox/flox and ApcΔ716 Trp53+/R270H intestinal tumors are shown (bottom). Each dot represents the average rate (%) of the branching number in the individual mouse tumors. (e) Representative micrographs of human CRC with TP53 wild-type and R273H mutation (left, H&E). Bars, 200μm. Branching scores of human CRC with TP53 mutations around codon 273 (red, yellow and orange) compared with TP53 wild-type cases (blue) are shown (right). Asterisk, P<0.05.

