Figure 5.
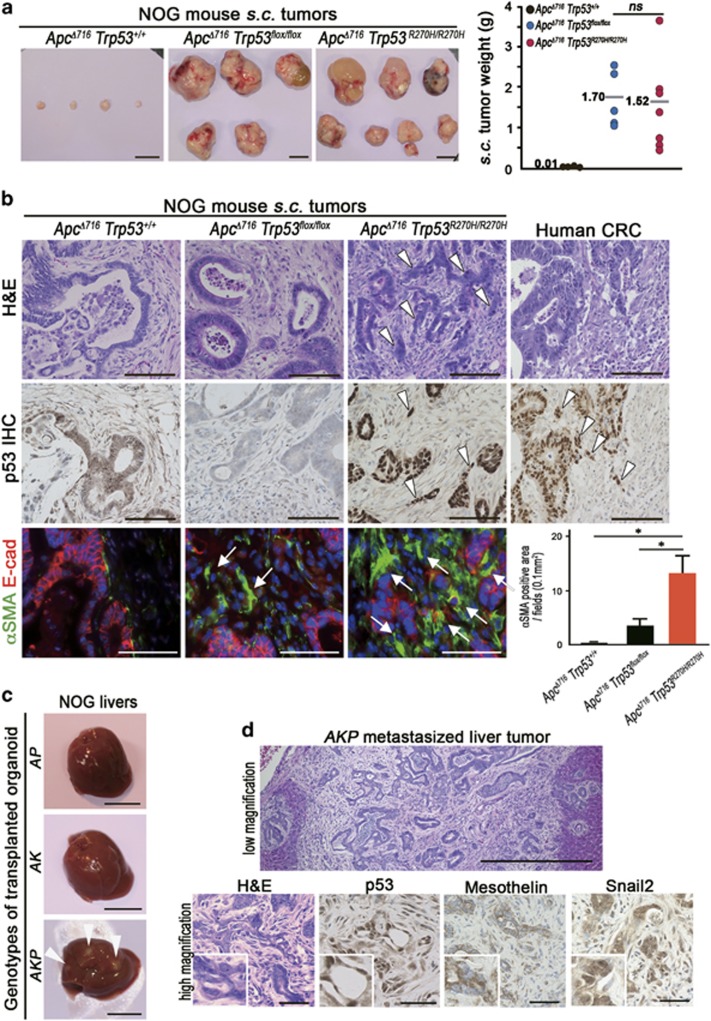
Malignant tumor formation in NOG mice by p53R270H organoids. (a) Representative macroscopic photographs of the organoid-derived s.c. tumors in NOG mice at 4 months after transplantation (left, three photographs). Bars, 1 cm. The weights of s.c. tumors for each genotype with the average are plotted in a dot graph (right). ns, not significant. (b) Representative histology photographs of organoid-derived s.c. tumors and human CRC (stage IIIB). H&E (top) and immunohistochemistory for p53 (middle) and double fluorescence immunostaining for αSMA (green) and E-cadherin (red) (bottom). The arrowheads indicate the sheets of tumor cells in ApcΔ716 Trp53R270H/R270H s.c. tumors and human CRC. The arrows indicate αSMA-positive myofibroblasts. Bars, 100 μm. The αSMA-positive areas for each tumor genotype determined using fluorescence immunohistochemistry are shown as a bar graph (mean±s.d.). Asterisks, P<0.05. (c) The macroscopic photographs of NOG mouse livers at 1 month after injection of the organoids into the spleen. The arrowheads indicate metastasized tumors. AP, ApcΔ716 Trp53R270H/R270H; AK, ApcΔ716 KrasG12D; AKP, ApcΔ716 KrasG12D Trp53+/R270H. Bars, 1 cm. (d) Representative photographs of metastasized AKP organoid-derived tumors in NOG mouse livers. H&E staining (top and bottom left) and immunohistochemistry for p53, mesothelin and Snail2 (bottom, left to right). Bars, 500 μm (top) and 50 μm (bottom).

