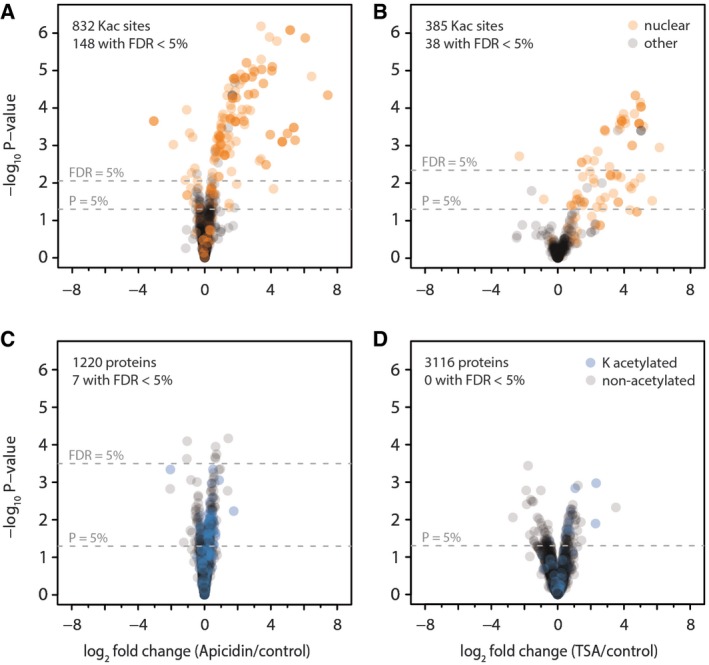
Figure 3. Differential lysine acetylation and protein expression in Arabidopsis leaves after inhibitor treatment.

-
A–DVacuum infiltration of leaf strips with solutions containing either of the two deacetylase inhibitors apicidin (A, C) or trichostatin A (B, D) versus a buffer control for 4 h leads to differential accumulation of lysine acetylation sites. Volcano plots depict lysine acetylation site ratios (A, B) or protein ratios (C, D) for inhibitor treatment versus control, with P‐values determined using the LIMMA package. Orange, protein with nuclear localization according to SUBA4 database. Blue, proteins with lysine acetylation sites identified. Dashed lines indicate significance thresholds of either uncorrected P‐values < 5% or Benjamini–Hochberg corrected FDR < 5%. A missing line indicates that the significance threshold was not reached by any of the data points.
