
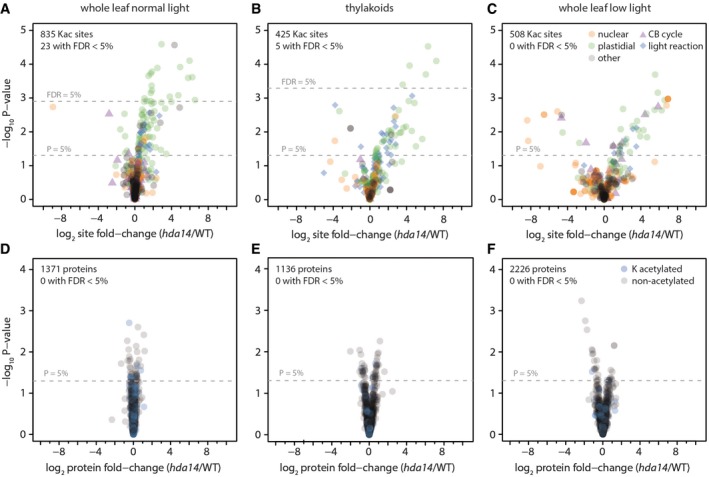
Figure 5. Differential lysine acetylation and protein expression in hda14 versus wild‐type leaves under normal light (A, D), in isolated thylakoids (B, E), and under low‐light conditions (C, F).
-
A–FVolcano plots depict lysine acetylation site ratios (A–C, top row) or protein ratios (D–F, bottom row) for mutant versus control, with P‐values determined using the LIMMA package. Orange, protein with nuclear localization; green, protein with plastidial localization; purple triangles, proteins of the Calvin–Benson (CB) cycle; blue diamonds (top row), proteins of the light reaction; localization information according to SUBA4 database. Blue circles (bottom row), proteins with lysine acetylation sites identified. Dashed lines indicate significance thresholds of either uncorrected P‐values < 5% or Benjamini–Hochberg corrected FDR < 5%. A missing FDR line indicates that the 5% threshold was not reached by any of the data points.