
Figure EV3. Internal replicate analysis by strictly standardized mean difference (IRA/SSMD).
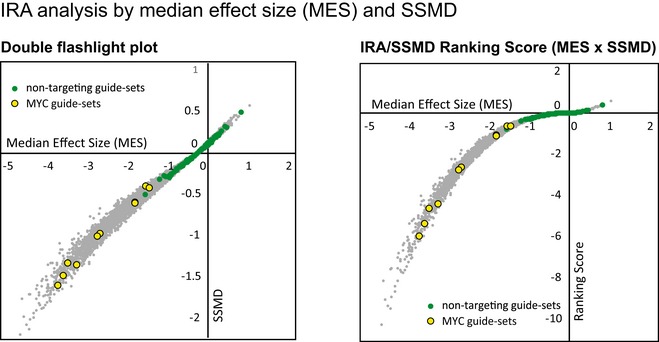
Left: Double flashlight plot. SSMDs for all >23,000 guide‐sets are plotted against their median effect sizes (MES) for 64 internal replicates. Green circles indicate non‐targeting control guide‐sets, and yellow circles indicate the 10 guide‐sets targeting MYC. Right: Ranking Score. A hit score was defined as the product of MES and SSMD. This score is negative for depleted guides and positive for enriched guides, and was used for guide ranking. The score was plotted against the median effect size for all guides. Green circles indicate non‐targeting control guide‐sets, and yellow circles indicate the 10 guide‐sets targeting MYC.