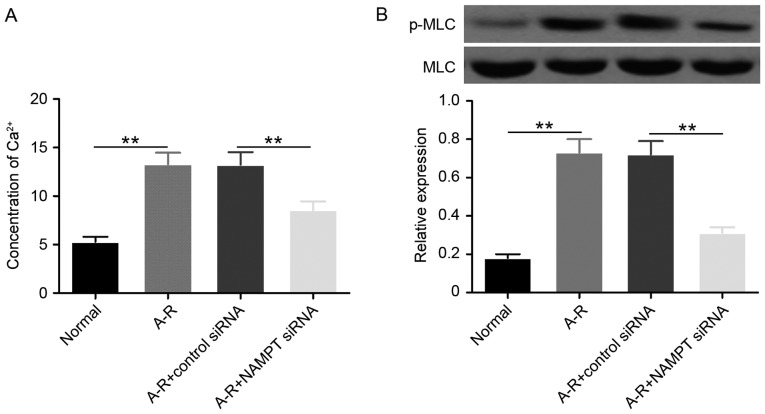
Figure 2.
NAMPT increases Ca2+ levels and MLC phosphorylation. (A) Ca2+ levels detected by Fura-2-acetoxymethyl ester assay, and (B) protein levels of MLC and p-MLC detected by western blot analysis in the four groups of treated cells. MLC was used as the internal control of p-MLC. Bar graph shows the mean ratios of the abundance of p-MLC to that of MLC in each sample. All the values are reported as the mean ± standard deviation based on three independent replicates. Statistically significant differences were calculated with the Student's t-test. **P<0.01. NAMPT, nicotinamide phosphoribosyltransferase; A-R, anoxia-reoxygenation; siRNA, small interfering RNA; MLC, myosin light-chain; p-MLC, phosphorylated MLC.

