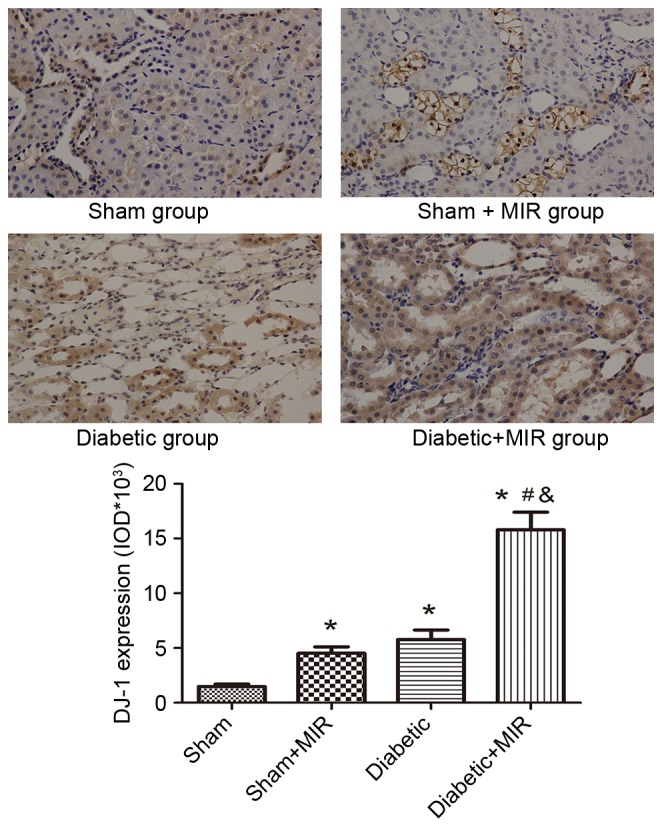
Figure 5.

Expression of DJ-1 in renal tissues assessed by immunohistochemistry (streptavidin peroxidase staining; magnification, ×400). Values are expressed as the mean ± standard error of the mean (n=8). *P<0.05 vs. sham group, #P<0.05 vs. sham + MIR group, &P<0.05 vs. diabetic group. MIR, myocardial ischemia/reperfusion; IOD, integrated optical density.
