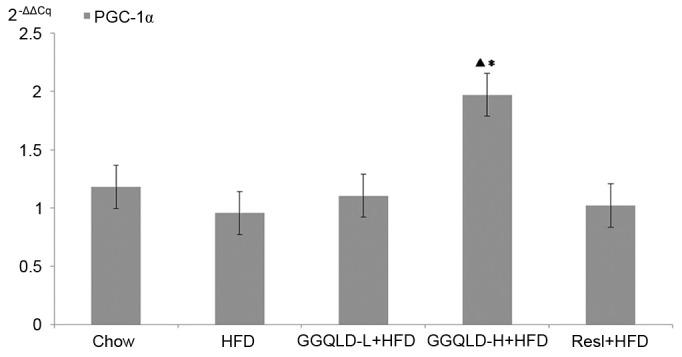
Figure 9.

Reverse transcription-quantitative polymerase chain reaction results for PGC-1α expression in liver tissue. ▲P<0.01 vs. chow; *P<0.01 vs. HFD. PGC-1α, peroxisome proliferator-activated receptor-γ coactivator-1α; HFD, high-fat diet; GGQLD-H, Gegen Qinlian decoction high dose; GGQLD-L, Gegen Qinlian decoction low dose; Resl, resveratrol.
