Figure 3.
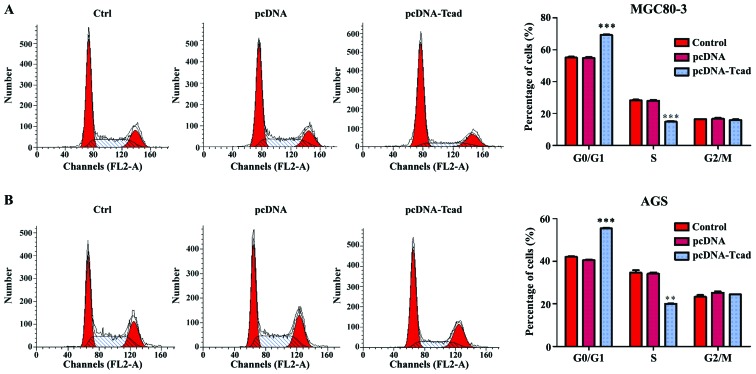
T-cadherin arrested cell cycle at G0/G1 phase in GC cells. Flow cytometry was used to analyze cell cycle distribution in empty vector pcDNA or pcDNA-T-cadherin (pcDNA-Tcad)-transfected (A) MGC80-3 and (B) AGS cells. Left panel shows representative dot plots and right panels show the quantitative analysis. These data are shown as the mean ± standard deviation of three independent experiments. **P<0.01, ***P<0.001 vs. control or empty vector pcDNA.

