Figure 2.
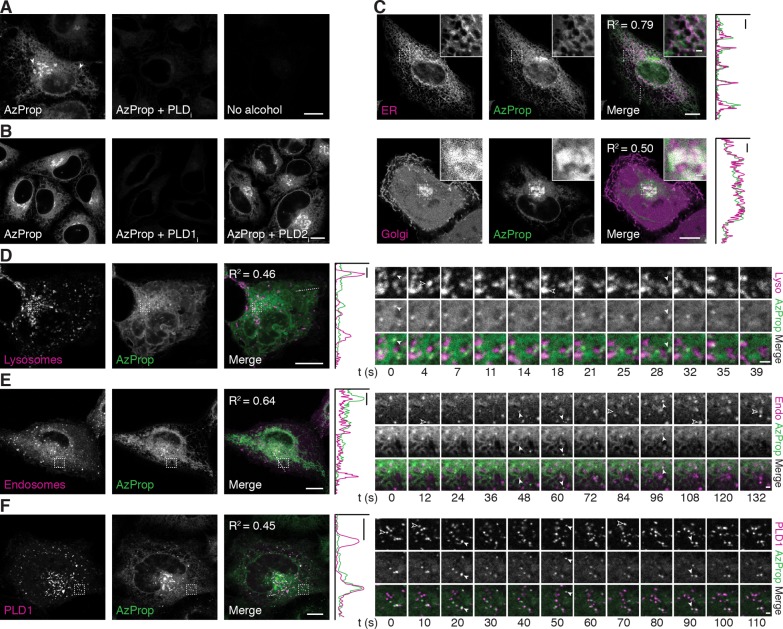
Live-cell imaging of PMA-stimulated PLD activity reveals pools of active enzyme on ER, Golgi, lysosomal, and endosomal membranes. (A, B) HeLa cells were first treated with the indicated PLD inhibitor (PLDi (FIPI), 750 nM; PLD1i (VU0359595), 250 nM; PLD2i (VU0364739), 350 nM) or DMSO vehicle for 30 min, followed by AzProp (1 mM) for 20 min, and then stimulated with PMA (100 nM) for 20 min. Cells were then incubated with 1 (1 μM) for 10 min, rinsed for 15 min, and imaged by confocal microscopy. Arrowheads denote AzProp-positive puncta. (C–F) HeLa cells were transfected with the indicated plasmids (ER, STIM1-mRFP; Golgi, mCherry-P4M; Lysosomes (Lyso), LAMP1-mRFP; Endosomes (Endo), Rab5-mRFP; PLD1, mCherry-PLD1) and then labeled as in panel A with AzProp, PMA, and 1. Shown are single z-slices, with zoomed-in regions indicated by dashed outline shown in the upper right corner. For entire z-stack, see Movies S1 and S2. For D–F, frames from time-lapse movies of representative zoomed-in regions (indicated by dashed outline) are shown. Solid arrowheads denote LAMP1/Rab5/PLD1 puncta that colocalize with the AzProp label, and hollow arrowheads denote LAMP1/Rab5/PLD1 puncta that do not contain the AzProp label. In merged images, colocalization appears white. For C–F, colocalization is demonstrated by intensity plots along a one-dimensional profile corresponding to the dashed line in the merged image. Pearson correlation coefficients (R2) are provided to aid in interpreting colocalization of the two markers. Scale bars: 10 μm for all except 1 μm for zoomed-in regions in C, time-lapse images in D–F, and one-dimensional profiles in C–F.

