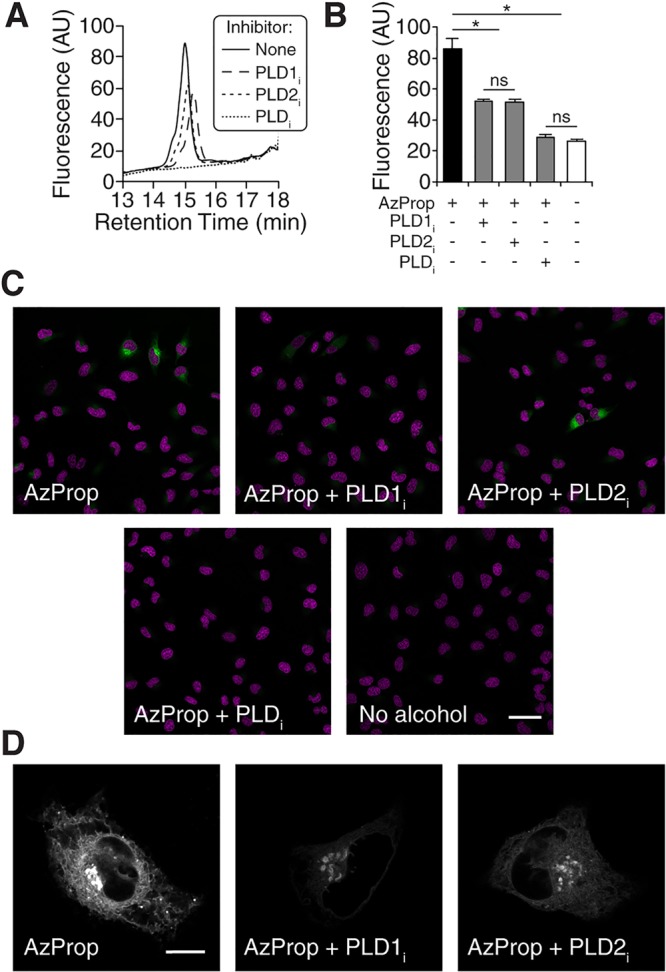
Figure 3.

AzProp labeling reveals heterogeneity of unstimulated PLD activity at the cellular level. HeLa cells were first treated with the indicated PLD inhibitor (PLDi (FIPI), 750 nM; PLD1i (VU0359595), 250 nM; PLD2i (VU0364739), 350 nM) or DMSO vehicle for 30 min, followed by AzProp (1 mM) for 120 min (or no alcohol for 120 min as indicated in panels B and C) and then further processed for analysis as described below. (A) For HPLC analysis, lipids were extracted, extracts were tagged by SPAAC with 1 and then analyzed by fluorescence-coupled HPLC. (B–D) For live-cell analysis, cells were then incubated with 1 (1 μM) for 10 min, rinsed for 15 min. (B) Cells were then analyzed by flow cytometry. Shown are mean fluorescence intensities of the cell populations. Black bars: AzProp + no inhibitor. Gray bars: AzProp + indicated PLD inhibitor. White bars: no alcohol. Error bars represent SEM. *, p < 0.01; n = 3 biological replicates. (C, D) Cells were further stained with Hoechst 33342 to mark nuclei and imaged by confocal microscopy. Single z-slices are shown at low (C) and high (D) magnification, and in panel C, AzProp fluorescence is in green and Hoechst 33342 is in magenta. Scale bars: 50 μm (C), 10 μm (D).
