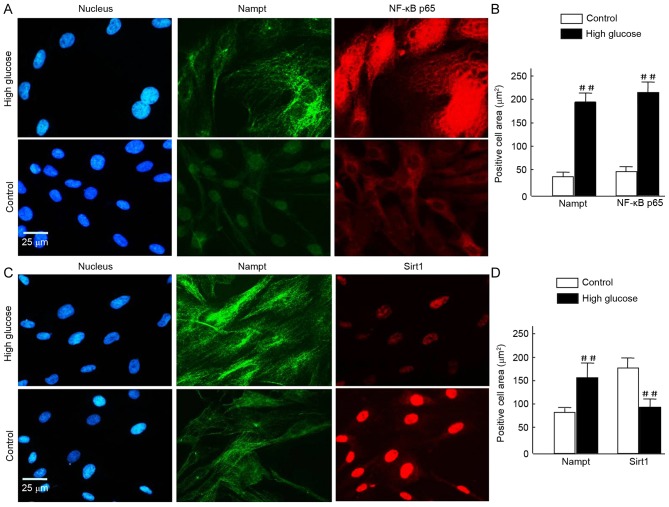
Figure 5.
(A-D) To assess cell morphology using fluorescence microscopy, HBZY-1 cells were exposed tohigh glucose for 120 h and subsequently fixed and stained with Alexa Fluor 488- and Alexa Fluor 594-conjugated rabbit antibodies against Nampt, NF-κB p65, and Sirt1, and DAPI (blue) for nuclear visualization. Similar results were obtained in 3 independent experiments. (A and C) In the images, Nampt staining is indicated in green, and NF-κB p65 or Sirt1 staining is indicated in red. Merged images reveal that the majority of Nampt staining co-localizes with both NF-κB p65 and Sirt1. (B and D) Positive signals were normalized to the cell area (integrated density/mm2) and quantitatively analyzed using Image J software. In each nephritic section, ≥10 areas containing ~100 cells were analyzed. Data are expressed as means ± standard deviations of four independent experiments (~50 cells per experiment). Magnification, ×40, Scale bar=25 µm. ##P<0.01 vs. control. Nampt, nicotinamide phosphoribosyltransferase; NF, nuclear factor; Sirt1, sirtuin 1.

