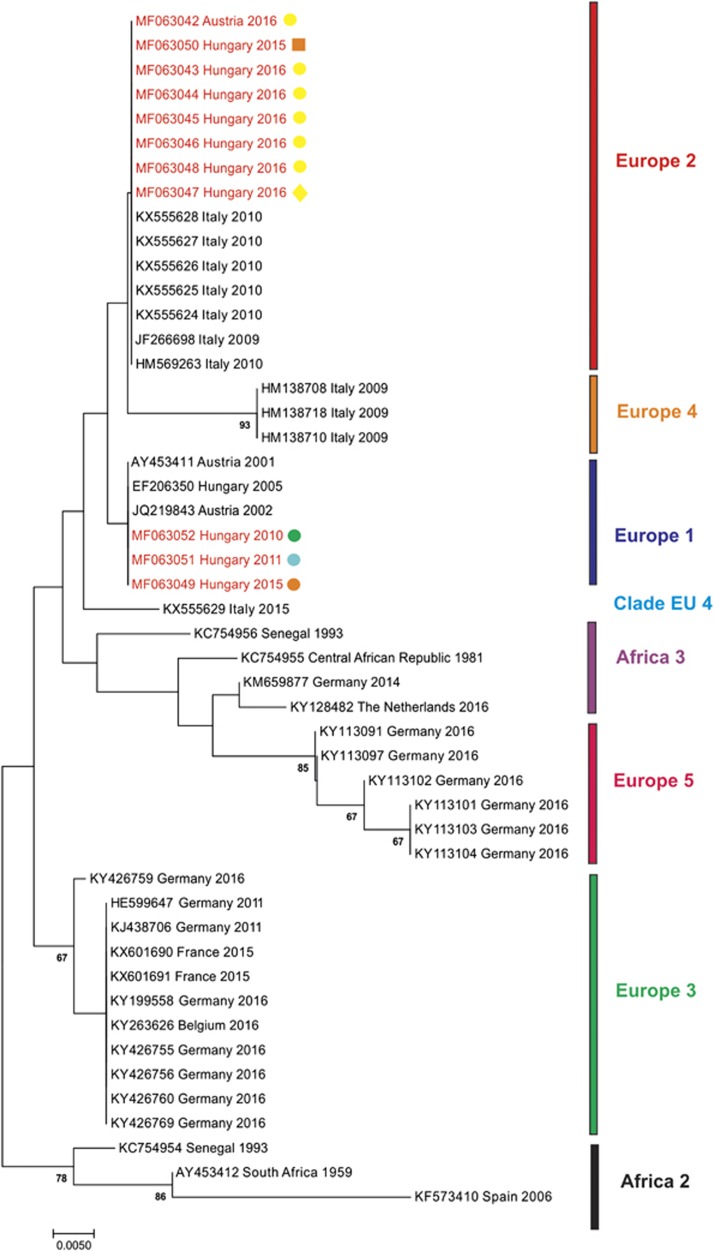
Figure 3.
Phylogram demonstrating the genetic relationships among Usutu viruses based on partial NS5 protein coding nucleotide sequences. Sequences are labeled by codes containing the GenBank accession number, country of origin and year of sample collection. The sequences from Austria and Hungary described in this paper are highlighted in red font. Colored symbols indicate host species and year of collection (corresponding with Figure 1). Vertical bars on the right indicate USUV genetic lineages (as suggested by Cadar et al.17 and Calzolari et al.21). The phylogram was generated with Bayesian statistical method; posterior support values above 60% are displayed. Horizontal bar on the left represents the genetic distance.

